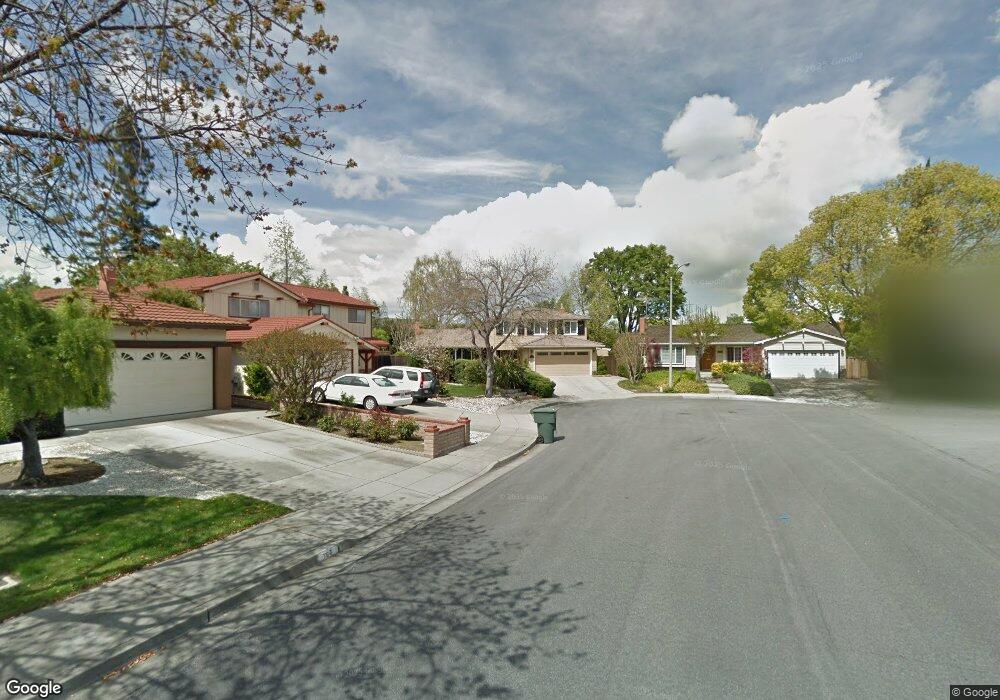
759 Silkoak Way Sunnyvale, CA 94086
Ponderosa Park NeighborhoodEstimated Value: $2,968,000 - $3,853,000
3
Beds
3
Baths
1,938
Sq Ft
$1,704/Sq Ft
Est. Value
About This Home
This home is located at 759 Silkoak Way, Sunnyvale, CA 94086 and is currently estimated at $3,302,651, approximately $1,704 per square foot. 759 Silkoak Way is a home located in Santa Clara County with nearby schools including Ponderosa Elementary School, Marian A. Peterson Middle School, and Adrian Wilcox High School.
Ownership History
Date
Name
Owned For
Owner Type
Purchase Details
Closed on
Jan 20, 1999
Sold by
Winkleman Charles E and Winkleman Juanita J
Bought by
Winkleman Charles E and Winkleman Juanita J
Current Estimated Value
Purchase Details
Closed on
Jul 1, 1998
Sold by
Winkelman Charles E and Winkelman Juanita J
Bought by
Winkelman Charles E and Winkelman Juanita J
Purchase Details
Closed on
Apr 23, 1998
Sold by
Winkleman Charles E and Winkleman Juanita J
Bought by
Winkelman Charles E and Winkelman Juanita J
Home Financials for this Owner
Home Financials are based on the most recent Mortgage that was taken out on this home.
Original Mortgage
$300,000
Interest Rate
7.06%
Purchase Details
Closed on
Sep 10, 1996
Sold by
Winkleman Charles E and Winkleman Juanita J
Bought by
Winkleman Charles E and Winkleman Juanita J
Create a Home Valuation Report for This Property
The Home Valuation Report is an in-depth analysis detailing your home's value as well as a comparison with similar homes in the area
Home Values in the Area
Average Home Value in this Area
Purchase History
| Date | Buyer | Sale Price | Title Company |
|---|---|---|---|
| Winkleman Charles E | -- | -- | |
| Winkelman Charles E | -- | Chicago Title Co | |
| Winkelman Charles E | -- | Chicago Title Co | |
| Winkleman Charles E | -- | -- |
Source: Public Records
Mortgage History
| Date | Status | Borrower | Loan Amount |
|---|---|---|---|
| Previous Owner | Winkelman Charles E | $300,000 |
Source: Public Records
Tax History
| Year | Tax Paid | Tax Assessment Tax Assessment Total Assessment is a certain percentage of the fair market value that is determined by local assessors to be the total taxable value of land and additions on the property. | Land | Improvement |
|---|---|---|---|---|
| 2025 | $1,914 | $165,419 | $29,309 | $136,110 |
| 2024 | $1,914 | $162,177 | $28,735 | $133,442 |
| 2023 | $1,892 | $158,998 | $28,172 | $130,826 |
| 2022 | $1,863 | $155,881 | $27,620 | $128,261 |
| 2021 | $1,852 | $152,826 | $27,079 | $125,747 |
| 2020 | $1,817 | $151,260 | $26,802 | $124,458 |
| 2019 | $1,814 | $148,295 | $26,277 | $122,018 |
| 2018 | $1,700 | $145,388 | $25,762 | $119,626 |
| 2017 | $1,687 | $142,538 | $25,257 | $117,281 |
| 2016 | $1,709 | $139,744 | $24,762 | $114,982 |
| 2015 | $1,701 | $137,646 | $24,391 | $113,255 |
| 2014 | $1,625 | $134,951 | $23,914 | $111,037 |
Source: Public Records
Map
Nearby Homes
- 949 Aster Ct
- 1006 E Evelyn Ave
- 922 Iris Ave
- 1062 Barberry Terrace
- 1052 Aster Ave
- 1098 Barberry Terrace
- 236 Red Oak Dr E Unit B
- 1035 Rockrose Ave
- 1093 Reed Ave Unit C
- 1091 Reed Ave Unit D
- 851 Mangrove Ave
- 999 W Evelyn Terrace Unit 40
- 999 W Evelyn Terrace Unit 54
- 483 Tea Tree Terrace
- 1107 Reed Ave Unit C
- 889 Rattan Terrace
- 201 Stone Pine Terrace Unit 2
- 647 Toyon Ave
- 1106 Althea Terrace Unit 3
- 1102 Althea Terrace Unit 1
- 1025 Fernleaf Dr
- 763 Silkoak Way
- 756 Shasta Fir Dr
- 760 Shasta Fir Dr
- 752 Shasta Fir Dr
- 764 Shasta Fir Dr
- 1029 Fernleaf Dr
- 767 Silkoak Way
- 747 Silver Pine Ct
- 748 Shasta Fir Dr
- 768 Shasta Fir Dr
- 1030 Fernleaf Dr
- 1033 Fernleaf Dr
- 771 Silkoak Way
- 772 Shasta Fir Dr
- 744 Shasta Fir Dr
- 752 Silver Pine Ct
- 1034 Fernleaf Dr
- 763 Shasta Fir Dr
- 767 Shasta Fir Dr
Your Personal Tour Guide
Ask me questions while you tour the home.