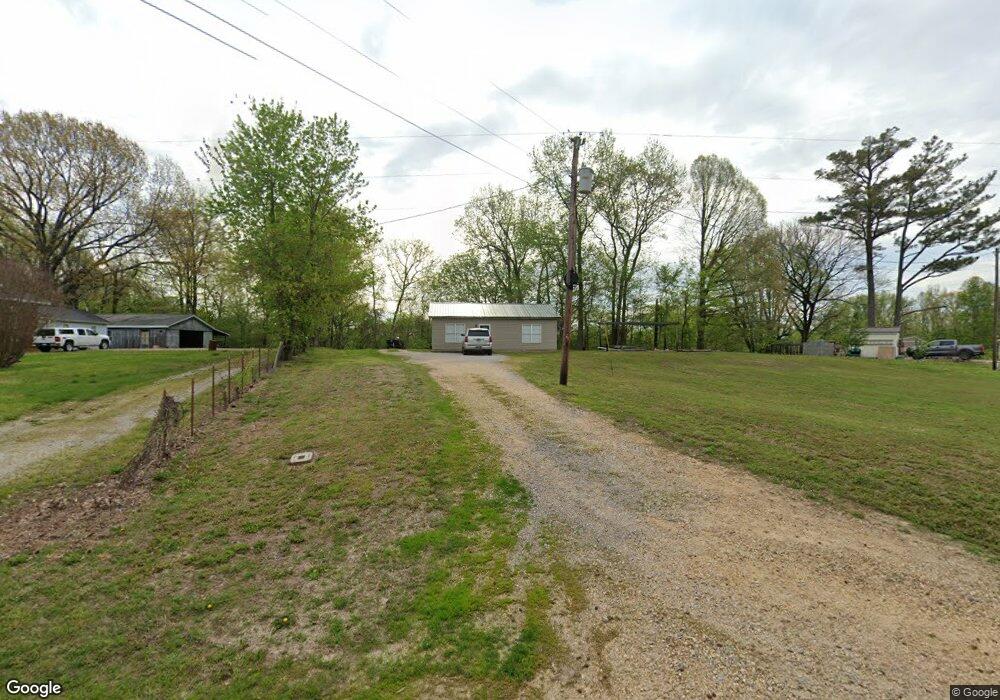
7593 Asbury Glimp Rd Ripley, TN 38063
Estimated Value: $82,833 - $122,000
--
Bed
1
Bath
1,144
Sq Ft
$94/Sq Ft
Est. Value
About This Home
This home is located at 7593 Asbury Glimp Rd, Ripley, TN 38063 and is currently estimated at $107,458, approximately $93 per square foot. 7593 Asbury Glimp Rd is a home located in Lauderdale County with nearby schools including Ripley Primary School, Ripley Elementary School, and Ripley Middle School.
Ownership History
Date
Name
Owned For
Owner Type
Purchase Details
Closed on
Aug 21, 2015
Sold by
Dunavant Beverly Carver
Bought by
Jones David R and Jones Linda D
Current Estimated Value
Home Financials for this Owner
Home Financials are based on the most recent Mortgage that was taken out on this home.
Original Mortgage
$20,538
Outstanding Balance
$16,114
Interest Rate
4.04%
Mortgage Type
New Conventional
Estimated Equity
$91,344
Purchase Details
Closed on
Oct 7, 2013
Sold by
Bratschi Brian Dylan
Bought by
Dunavant Beverly Carver
Purchase Details
Closed on
Jul 5, 2013
Sold by
Bratschi Brian
Bought by
Bratschi Bratschi Brian Dylan Brian Dylan and O Kim Bratschi C
Purchase Details
Closed on
Mar 14, 2007
Sold by
Barbara Bratschi
Bought by
Brian Bratschi
Purchase Details
Closed on
Jul 2, 1992
Bought by
Bratschi Brian
Purchase Details
Closed on
Feb 28, 1992
Bought by
Bratschi Brian and Bratschi Barbara
Purchase Details
Closed on
Dec 6, 1971
Bought by
Hopper Collise
Purchase Details
Closed on
Sep 14, 1970
Create a Home Valuation Report for This Property
The Home Valuation Report is an in-depth analysis detailing your home's value as well as a comparison with similar homes in the area
Home Values in the Area
Average Home Value in this Area
Purchase History
| Date | Buyer | Sale Price | Title Company |
|---|---|---|---|
| Jones David R | $8,000 | -- | |
| Dunavant Beverly Carver | $8,800 | -- | |
| Bratschi Bratschi Brian Dylan Brian Dylan | -- | -- | |
| Brian Bratschi | -- | -- | |
| Bratschi Brian | -- | -- | |
| Bratschi Brian | -- | -- | |
| Hopper Collise | -- | -- | |
| -- | -- | -- |
Source: Public Records
Mortgage History
| Date | Status | Borrower | Loan Amount |
|---|---|---|---|
| Open | Jones David R | $20,538 |
Source: Public Records
Tax History Compared to Growth
Tax History
| Year | Tax Paid | Tax Assessment Tax Assessment Total Assessment is a certain percentage of the fair market value that is determined by local assessors to be the total taxable value of land and additions on the property. | Land | Improvement |
|---|---|---|---|---|
| 2025 | $394 | $15,500 | $0 | $0 |
| 2024 | $394 | $15,500 | $2,025 | $13,475 |
| 2023 | $394 | $15,500 | $2,025 | $13,475 |
| 2022 | $394 | $15,500 | $2,025 | $13,475 |
| 2021 | $394 | $15,500 | $2,025 | $13,475 |
| 2020 | $355 | $15,500 | $2,025 | $13,475 |
| 2019 | $355 | $12,025 | $1,575 | $10,450 |
| 2018 | $355 | $12,025 | $1,575 | $10,450 |
| 2017 | $358 | $12,025 | $1,575 | $10,450 |
| 2016 | $347 | $11,675 | $1,575 | $10,100 |
| 2015 | $259 | $11,675 | $1,575 | $10,100 |
| 2014 | $289 | $9,950 | $1,675 | $8,275 |
Source: Public Records
Map
Nearby Homes
- 1240 Crutcher Rd
- LOT #10 Luckett Three Points Rd
- LOT #11 Luckett Three Points Rd
- 4638 Asbury Glimp Rd
- 1027 Lynn School Rd
- 4080 Craig Rd
- 5066 Lightfoot Luckett Rd
- LOT #9 Three Points Cove
- 3758 Craig Rd
- 0 Rickey Cove Unit 10126394
- 0 Johnston St Unit 10194911
- 0 Hanna Dr Unit 231744
- 0 Rickey Cove Unit 231745
- 0 Hanna Dr Unit 10126338
- 00 Edith Nankipoo Rd
- 50 Poplar Grove Cemetery Rd
- 465 Thum Ave
- 217 Graves Ave
- 3690 Lovelace Crossing Rd
- 0 87 Hwy Unit 10205304
- 7627 Asbury Glimp Rd
- 7549 Asbury Glimp Rd
- 7686 Asbury Glimp Rd
- 7529 Asbury Glimp Rd
- 7526 Asbury Glimp Rd
- 7481 Asbury Glimp Rd
- 7480 Asbury Glimp Rd
- 7480 Asbury Glimp Rd
- 4641 Highway 87 W
- 4659 Highway 87 W
- 4659 Tennessee 87
- 4713 Highway 87 W
- 4264 Tennessee 87
- 0 Junius Lee Rd
- 4892 Highway 87 W
- 234 Glissen Rd
- 240 Glissen Rd
- 4726 Highway 87 W
- 4759 Highway 87 W
- 7299 Asbury Glimp Rd