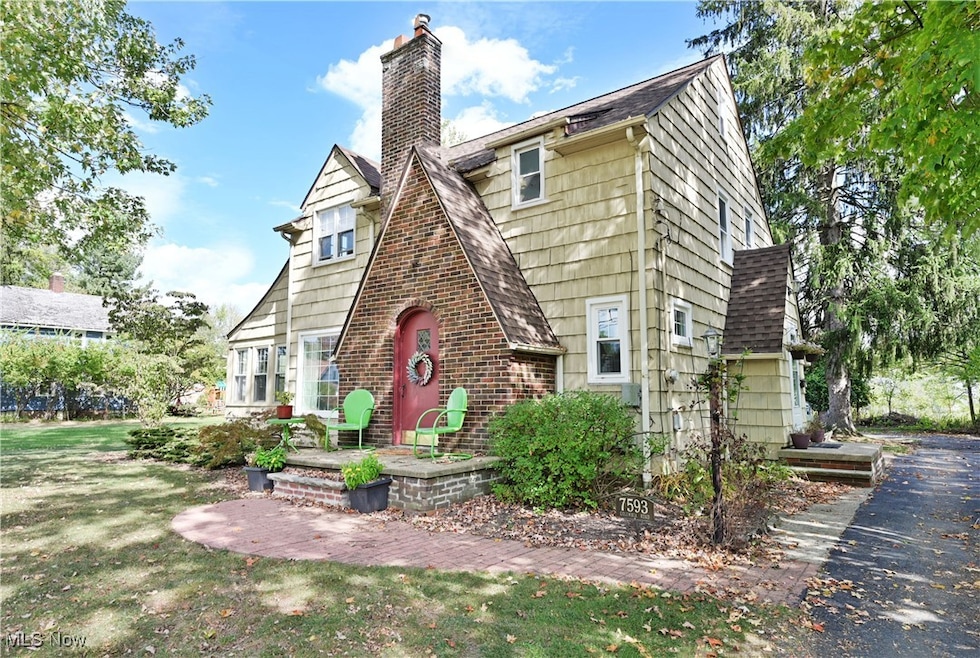
7593 Columbia Rd Olmsted Falls, OH 44138
Estimated payment $1,900/month
Highlights
- Colonial Architecture
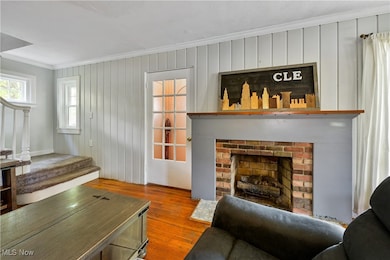
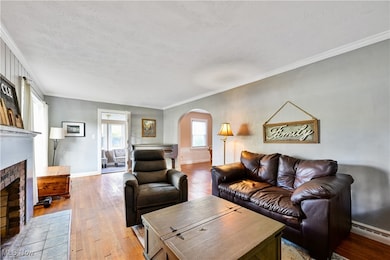
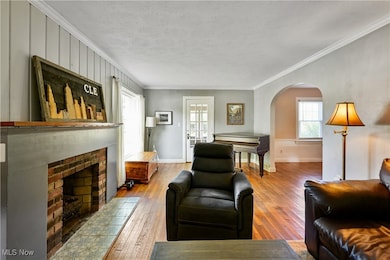
- 1 Fireplace
- 2 Car Detached Garage
- Falls-Lenox Primary Elementary School Rated A-
- No HOA
- 1-minute walk to Village Green Park
About This Home
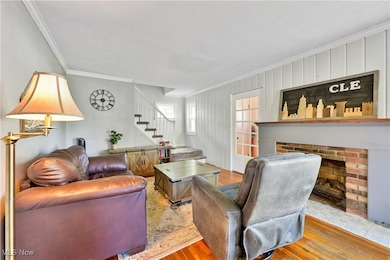
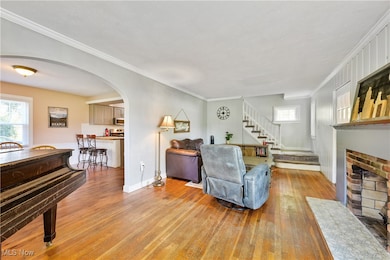
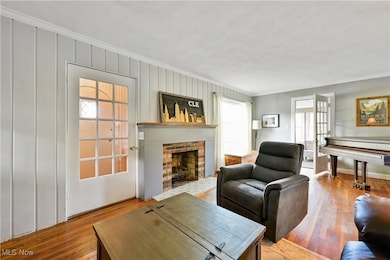
Located in Beautiful historic district of Olmsted Falls within walking distance to restaurants, shopping, and parks. This home has charm and character galore. Open floor plan on 1st floor with spacious living room with fireplace accent. Formal dining room with corner China cabinets is open to kitchen. Heated sunroom with windows surrounds is off living room. Kitchen updated in 2024, plus all new appliances. Both baths have been updated- Walk up attic entrance off bath on 2nd floor- New windows 2025 (except for sunroom and bedrooms)- New roof on home and garage 2019 (tear off)- Base of front steps rebuilt in 2024- Exterior of home power washed 8/2025- New garage door 2021- gutters on home and garage cleaned 8/2025- A one year home owner warranty is included with this home- A fabulous location with Coe Lake and Wallace Lake in Berea, and Metro Parks within 7-12 minutes.
Listing Agent
Howard Hanna Brokerage Email: donnamartin@howardhanna.com, 440-552-2139 License #241227 Listed on: 10/08/2025

Open House Schedule
-
Sunday, November 23, 20251:00 to 3:00 pm11/23/2025 1:00:00 PM +00:0011/23/2025 3:00:00 PM +00:00Add to Calendar
Home Details
Home Type
- Single Family
Est. Annual Taxes
- $6,358
Year Built
- Built in 1925
Lot Details
- 0.33 Acre Lot
- Lot Dimensions are 72x165
- Irregular Lot
Parking
- 2 Car Detached Garage
Home Design
- Colonial Architecture
- Fiberglass Roof
Interior Spaces
- 1,457 Sq Ft Home
- 2-Story Property
- 1 Fireplace
- Window Treatments
- Entrance Foyer
Kitchen
- Range
- Microwave
- Dishwasher
- Disposal
Bedrooms and Bathrooms
- 3 Bedrooms
- 1.5 Bathrooms
Laundry
- Dryer
- Washer
Unfinished Basement
- Sump Pump
- Laundry in Basement
Outdoor Features
- Patio
Utilities
- Window Unit Cooling System
- Forced Air Heating System
- Heating System Uses Gas
Listing and Financial Details
- Home warranty included in the sale of the property
- Assessor Parcel Number 281-05-008
Community Details
Overview
- No Home Owners Association
- Olmsted 05 Subdivision
Amenities
- Shops
- Restaurant
Recreation
- Park
Map
Home Values in the Area
Average Home Value in this Area
Tax History
| Year | Tax Paid | Tax Assessment Tax Assessment Total Assessment is a certain percentage of the fair market value that is determined by local assessors to be the total taxable value of land and additions on the property. | Land | Improvement |
|---|---|---|---|---|
| 2024 | $6,358 | $88,830 | $14,455 | $74,375 |
| 2023 | $5,751 | $65,000 | $14,460 | $50,540 |
| 2022 | $5,705 | $65,000 | $14,460 | $50,540 |
| 2021 | $5,089 | $65,000 | $14,460 | $50,540 |
| 2020 | $4,729 | $51,980 | $11,550 | $40,430 |
| 2019 | $4,193 | $148,500 | $33,000 | $115,500 |
| 2018 | $4,223 | $51,980 | $11,550 | $40,430 |
| 2017 | $4,340 | $49,920 | $11,310 | $38,610 |
| 2016 | $4,318 | $49,920 | $11,310 | $38,610 |
| 2015 | $4,004 | $49,920 | $11,310 | $38,610 |
| 2014 | $4,004 | $46,210 | $10,470 | $35,740 |
Property History
| Date | Event | Price | List to Sale | Price per Sq Ft |
|---|---|---|---|---|
| 10/29/2025 10/29/25 | Price Changed | $259,900 | -3.7% | $178 / Sq Ft |
| 10/08/2025 10/08/25 | For Sale | $269,900 | -- | $185 / Sq Ft |
Purchase History
| Date | Type | Sale Price | Title Company |
|---|---|---|---|
| Warranty Deed | $150,500 | Lawyers Title Insurance Corp | |
| Deed | $59,000 | -- | |
| Deed | -- | -- | |
| Deed | $56,000 | -- | |
| Deed | $45,000 | -- | |
| Deed | -- | -- |
Mortgage History
| Date | Status | Loan Amount | Loan Type |
|---|---|---|---|
| Open | $135,450 | Purchase Money Mortgage |
Source: MLS Now (Howard Hanna)
MLS Number: 5163134
APN: 281-05-008
Disclaimer: Certain information contained herein is derived from information provided by parties other than Homes.com. All information provided is deemed reliable, but is not guaranteed to be accurate and should be independently verified.
![]() Certain information contained herein is derived from information provided by parties other than Homes.com. All information provided is deemed reliable, but is not guaranteed to be accurate and should be independently verified.
Certain information contained herein is derived from information provided by parties other than Homes.com. All information provided is deemed reliable, but is not guaranteed to be accurate and should be independently verified.
- 109 Marble Ct
- 9299 Columbia Rd
- 5800 Great Northern Blvd
- 27080 Oakwood Dr
- 326 W Bagley Rd
- 55 Barrett Rd
- 1000 Stone Ridge Cir
- 9640 Fernwood Dr
- 26640 Lake of the Falls Blvd Unit 26640
- 5264 Victoria Ln
- 21480 Sheldon Rd
- 5250 Columbia Rd
- 26101 Country Club Blvd
- 25801 Country Club Blvd
- 775 Shelley Pkwy
- 24851 Country Club Blvd
- 125 Sheldon Rd
- 80 Emerson Ave
- 375-381 Front St
- 369 Front St Unit Townhouse