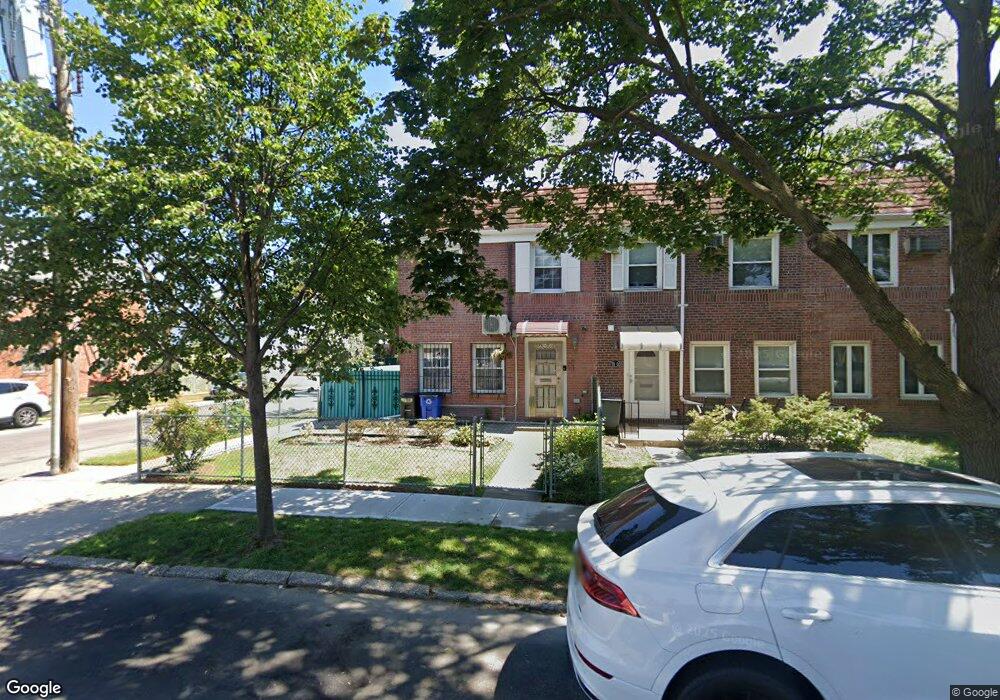
76-01 169th St Fresh Meadows, NY 11366
Hillcrest NeighborhoodEstimated Value: $888,000 - $938,000
3
Beds
3
Baths
1,224
Sq Ft
$751/Sq Ft
Est. Value
About This Home
This home is located at 76-01 169th St, Fresh Meadows, NY 11366 and is currently estimated at $919,773, approximately $751 per square foot. 76-01 169th St is a home located in Queens County with nearby schools including P.S. 173 - Fresh Meadow and George J. Ryan Middle School 216.
Ownership History
Date
Name
Owned For
Owner Type
Purchase Details
Closed on
May 4, 2007
Sold by
Dong Yue Yue and Sung Kunlin
Bought by
Wang Hong and Xu Gang
Current Estimated Value
Home Financials for this Owner
Home Financials are based on the most recent Mortgage that was taken out on this home.
Original Mortgage
$415,000
Outstanding Balance
$252,569
Interest Rate
6.18%
Mortgage Type
Purchase Money Mortgage
Estimated Equity
$667,204
Purchase Details
Closed on
Sep 7, 2000
Sold by
Malka Salomon and Malka Neri
Bought by
Sung Kunlin and Dong Yue Yue
Purchase Details
Closed on
Jun 25, 1996
Sold by
Leichman Max and Leichman Annette
Bought by
Malka Salomon and Malka Neri
Home Financials for this Owner
Home Financials are based on the most recent Mortgage that was taken out on this home.
Original Mortgage
$157,500
Interest Rate
8.08%
Mortgage Type
Purchase Money Mortgage
Create a Home Valuation Report for This Property
The Home Valuation Report is an in-depth analysis detailing your home's value as well as a comparison with similar homes in the area
Home Values in the Area
Average Home Value in this Area
Purchase History
| Date | Buyer | Sale Price | Title Company |
|---|---|---|---|
| Wang Hong | $540,000 | -- | |
| Wang Hong | $540,000 | -- | |
| Sung Kunlin | $297,000 | -- | |
| Sung Kunlin | $297,000 | -- | |
| Malka Salomon | $175,000 | -- | |
| Malka Salomon | $175,000 | -- |
Source: Public Records
Mortgage History
| Date | Status | Borrower | Loan Amount |
|---|---|---|---|
| Open | Wang Hong | $415,000 | |
| Closed | Wang Hong | $415,000 | |
| Previous Owner | Malka Salomon | $157,500 |
Source: Public Records
Tax History Compared to Growth
Tax History
| Year | Tax Paid | Tax Assessment Tax Assessment Total Assessment is a certain percentage of the fair market value that is determined by local assessors to be the total taxable value of land and additions on the property. | Land | Improvement |
|---|---|---|---|---|
| 2025 | $7,916 | $40,608 | $11,991 | $28,617 |
| 2024 | $7,916 | $39,413 | $11,682 | $27,731 |
| 2023 | $7,597 | $37,822 | $10,311 | $27,511 |
| 2022 | $7,153 | $50,280 | $14,280 | $36,000 |
| 2021 | $7,245 | $50,460 | $14,280 | $36,180 |
| 2020 | $6,867 | $46,320 | $14,280 | $32,040 |
| 2019 | $6,578 | $46,140 | $14,280 | $31,860 |
| 2018 | $6,127 | $31,518 | $11,146 | $20,372 |
| 2017 | $5,787 | $29,859 | $11,104 | $18,755 |
| 2016 | $5,659 | $29,859 | $11,104 | $18,755 |
| 2015 | $3,178 | $28,200 | $11,471 | $16,729 |
| 2014 | $3,178 | $27,370 | $12,288 | $15,082 |
Source: Public Records
Map
Nearby Homes