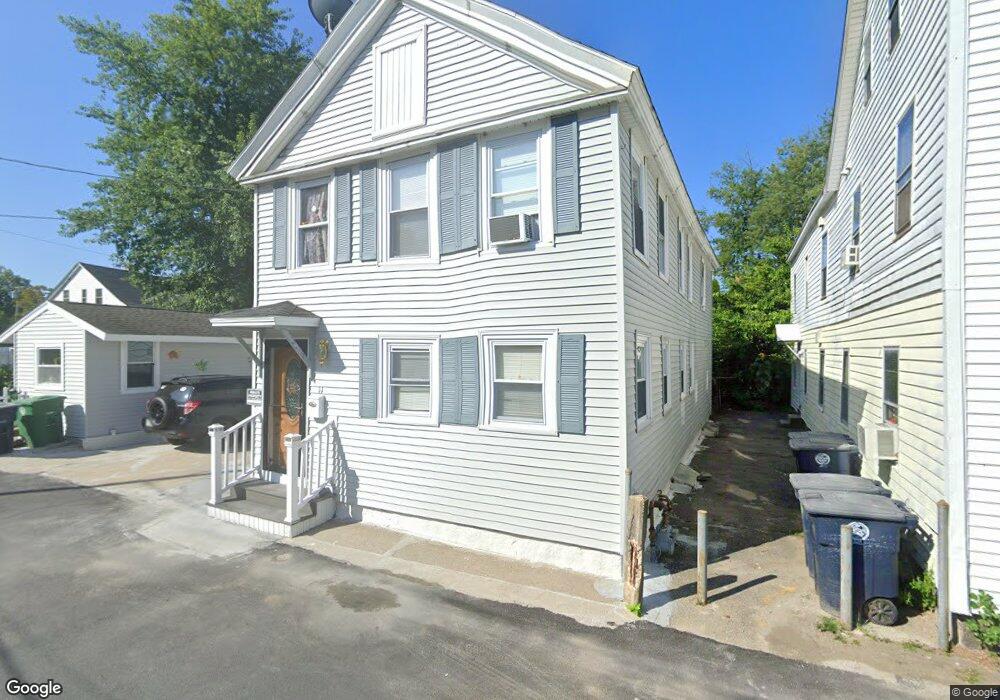
76 1/2 Ledge St Nashua, NH 03060
Mine Falls Park NeighborhoodEstimated Value: $370,000 - $425,419
3
Beds
2
Baths
1,608
Sq Ft
$252/Sq Ft
Est. Value
About This Home
This home is located at 76 1/2 Ledge St, Nashua, NH 03060 and is currently estimated at $404,605, approximately $251 per square foot. 76 1/2 Ledge St is a home located in Hillsborough County with nearby schools including Ledge Street Elementary School, Fairgrounds Middle School, and Nashua High School South.
Ownership History
Date
Name
Owned For
Owner Type
Purchase Details
Closed on
May 11, 2010
Sold by
Bank New York Mellon T
Bought by
Oneil-Gershon Livia and Oneil-Willoughby Jason
Current Estimated Value
Home Financials for this Owner
Home Financials are based on the most recent Mortgage that was taken out on this home.
Original Mortgage
$103,920
Interest Rate
5.03%
Mortgage Type
Purchase Money Mortgage
Purchase Details
Closed on
Sep 14, 2009
Sold by
Rousseau William and Bank New York Mellon T
Bought by
Bank New York Mellon T
Create a Home Valuation Report for This Property
The Home Valuation Report is an in-depth analysis detailing your home's value as well as a comparison with similar homes in the area
Home Values in the Area
Average Home Value in this Area
Purchase History
| Date | Buyer | Sale Price | Title Company |
|---|---|---|---|
| Oneil-Gershon Livia | $129,900 | -- | |
| Bank New York Mellon T | $106,300 | -- |
Source: Public Records
Mortgage History
| Date | Status | Borrower | Loan Amount |
|---|---|---|---|
| Open | Bank New York Mellon T | $97,000 | |
| Closed | Bank New York Mellon T | $103,920 | |
| Previous Owner | Bank New York Mellon T | $25,000 |
Source: Public Records
Tax History Compared to Growth
Tax History
| Year | Tax Paid | Tax Assessment Tax Assessment Total Assessment is a certain percentage of the fair market value that is determined by local assessors to be the total taxable value of land and additions on the property. | Land | Improvement |
|---|---|---|---|---|
| 2024 | $5,807 | $365,200 | $117,900 | $247,300 |
| 2023 | $5,755 | $315,700 | $94,300 | $221,400 |
| 2022 | $5,705 | $315,700 | $94,300 | $221,400 |
| 2021 | $4,786 | $206,100 | $59,700 | $146,400 |
| 2020 | $4,660 | $206,100 | $59,700 | $146,400 |
| 2019 | $4,485 | $206,100 | $59,700 | $146,400 |
| 2018 | $4,263 | $201,000 | $59,700 | $141,300 |
| 2017 | $3,678 | $142,600 | $59,300 | $83,300 |
| 2016 | $3,575 | $142,600 | $59,300 | $83,300 |
| 2015 | $3,498 | $142,600 | $59,300 | $83,300 |
| 2014 | $3,430 | $142,600 | $59,300 | $83,300 |
Source: Public Records
Map
Nearby Homes
- 4 Badger St
- 30 Ledge St
- 22 Wilder St
- 32-34 Grand Ave
- 169A W Hollis St Unit 193
- 38 Central St
- 29 Wilder St
- 8 Buck St Unit 10
- 121 Palm St
- 6 Lake Ave
- 7 Bitirnas St Unit U7
- 5 Mulberry St
- 22 New Dunstable Rd Unit 132133
- 15 Lovell St Unit 20
- 15 Lovell St Unit 3
- 15 Lovell St Unit 7
- 15 Lovell St Unit 10
- 41 New Dunstable Rd Unit 371
- 97 Linwood St
- 52 Main St Unit 402