76 Bassett Ln Newfields, NH 03856
Estimated Value: $987,000 - $1,280,000
4
Beds
3
Baths
3,266
Sq Ft
$338/Sq Ft
Est. Value
About This Home
This home is located at 76 Bassett Ln, Newfields, NH 03856 and is currently estimated at $1,102,445, approximately $337 per square foot. 76 Bassett Ln is a home located in Rockingham County with nearby schools including Newfields Elementary School, Cooperative Middle School, and Exeter High School.
Ownership History
Date
Name
Owned For
Owner Type
Purchase Details
Closed on
Sep 10, 2021
Sold by
Ward Jeffrey
Bought by
Tracy A Birmingham Ret and Birmingham
Current Estimated Value
Purchase Details
Closed on
May 21, 2004
Sold by
Alexander Robert and Alexander Norah B
Bought by
Ward Jeffrey
Home Financials for this Owner
Home Financials are based on the most recent Mortgage that was taken out on this home.
Original Mortgage
$333,700
Interest Rate
5.75%
Mortgage Type
Purchase Money Mortgage
Purchase Details
Closed on
Jun 11, 2003
Sold by
Beaulieu Paul and Beaulieu Tracey M
Bought by
Alexander Robert and Alexander Norah B
Purchase Details
Closed on
Jun 22, 1998
Sold by
Eidos Bldrs Inc
Bought by
Beaulieu Paul and Beaulieu Tracey M
Create a Home Valuation Report for This Property
The Home Valuation Report is an in-depth analysis detailing your home's value as well as a comparison with similar homes in the area
Home Values in the Area
Average Home Value in this Area
Purchase History
| Date | Buyer | Sale Price | Title Company |
|---|---|---|---|
| Tracy A Birmingham Ret | -- | None Available | |
| Tracy A Birmingham Ret | -- | None Available | |
| Tracy A Birmingham Ret | -- | None Available | |
| Ward Jeffrey | $472,500 | -- | |
| Alexander Robert | $435,000 | -- | |
| Beaulieu Paul | $299,900 | -- |
Source: Public Records
Mortgage History
| Date | Status | Borrower | Loan Amount |
|---|---|---|---|
| Previous Owner | Beaulieu Paul | $270,000 | |
| Previous Owner | Beaulieu Paul | $298,198 | |
| Previous Owner | Beaulieu Paul | $303,000 | |
| Previous Owner | Beaulieu Paul | $333,700 |
Source: Public Records
Tax History
| Year | Tax Paid | Tax Assessment Tax Assessment Total Assessment is a certain percentage of the fair market value that is determined by local assessors to be the total taxable value of land and additions on the property. | Land | Improvement |
|---|---|---|---|---|
| 2025 | $13,904 | $820,300 | $291,800 | $528,500 |
| 2024 | $13,199 | $820,300 | $291,800 | $528,500 |
| 2023 | $12,787 | $809,800 | $291,800 | $518,000 |
| 2022 | $11,933 | $569,300 | $231,300 | $338,000 |
| 2021 | $11,699 | $569,300 | $231,300 | $338,000 |
| 2020 | $12,073 | $568,400 | $231,300 | $337,100 |
| 2019 | $11,703 | $568,400 | $231,300 | $337,100 |
| 2018 | $6,204 | $568,400 | $231,300 | $337,100 |
| 2017 | $6,055 | $488,200 | $229,600 | $258,600 |
| 2016 | $11,218 | $483,100 | $229,600 | $253,500 |
| 2015 | $11,126 | $483,100 | $229,600 | $253,500 |
| 2014 | $11,715 | $483,100 | $229,600 | $253,500 |
| 2013 | $11,730 | $483,100 | $229,600 | $253,500 |
Source: Public Records
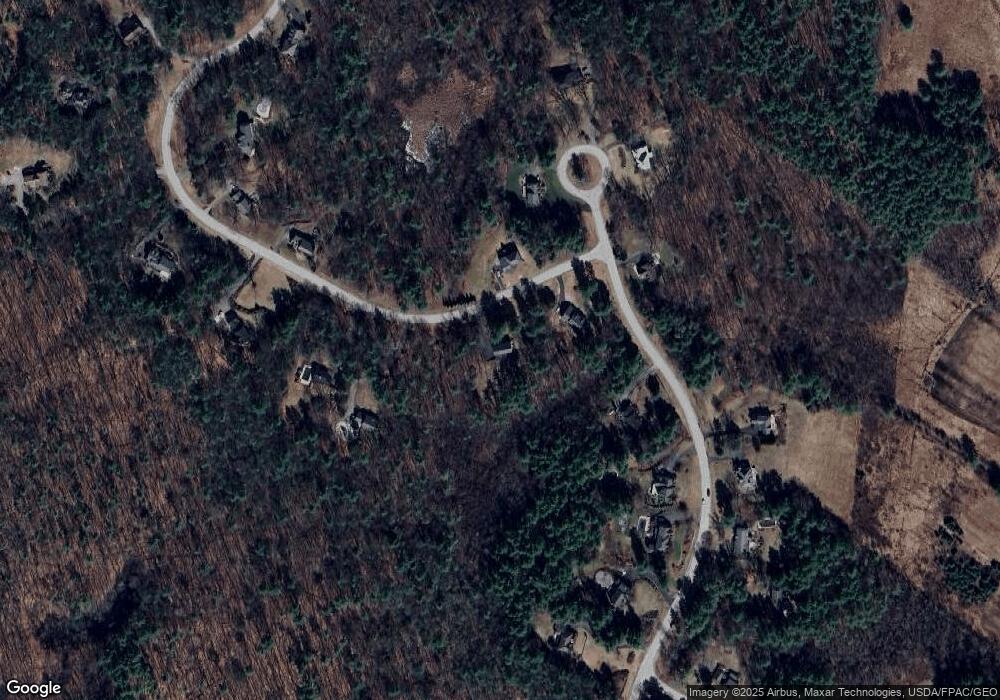
Map
Nearby Homes
- 120 Exeter Rd
- 104 Piscassic Rd
- 28 Partridge Hill Rd
- 9 Captain's Way
- 00 Piscassic & Oaklands Rd Unit 1
- 3 Swamscott St
- 10 Wingate Ct
- 19 Halls Mill Rd
- 9 Railroad Ave
- 12 Runaway Rd
- 5 Ridge Rd
- 56 Peninsula Dr
- 63 Peninsula Dr
- 25 Peninsula Dr
- 60 Peninsula Dr
- 221 Piscassic Rd
- 85 College Rd
- 23 Winding Brook Dr
- 20 Doe Run Ln
- 0 Autumn Ln
Your Personal Tour Guide
Ask me questions while you tour the home.