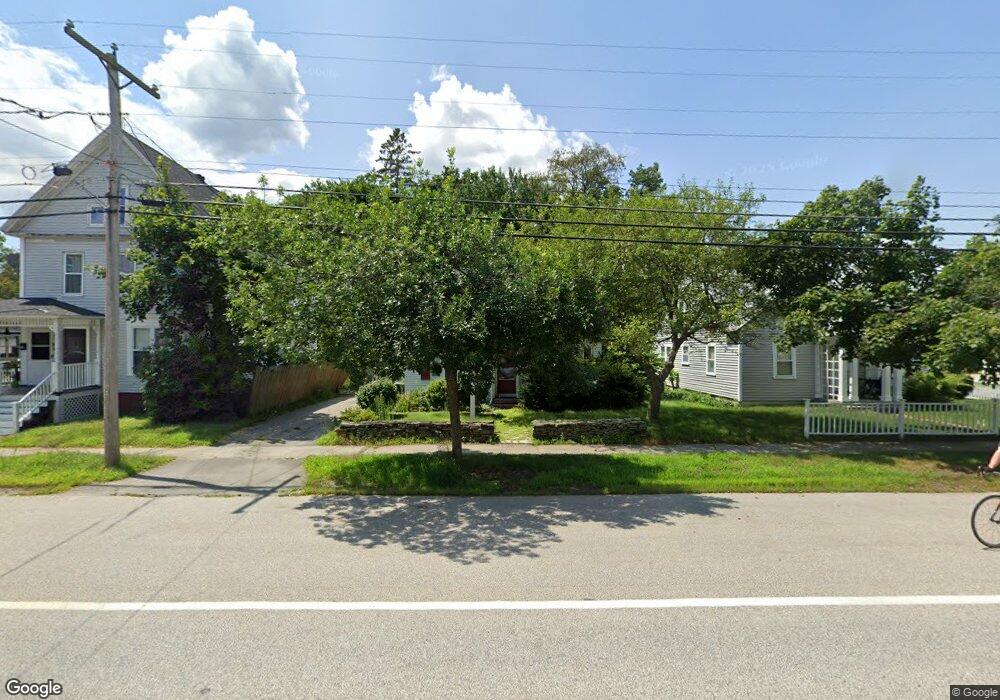
76 Broadway Concord, NH 03301
South End NeighborhoodEstimated Value: $490,000 - $588,000
4
Beds
3
Baths
2,165
Sq Ft
$251/Sq Ft
Est. Value
About This Home
This home is located at 76 Broadway, Concord, NH 03301 and is currently estimated at $543,055, approximately $250 per square foot. 76 Broadway is a home located in Merrimack County with nearby schools including Abbot-Downing School, Rundlett Middle School, and Concord High School.
Ownership History
Date
Name
Owned For
Owner Type
Purchase Details
Closed on
Dec 9, 2005
Sold by
Robert C Oakes T
Bought by
Neville Michelle T and Neville Jayson P
Current Estimated Value
Home Financials for this Owner
Home Financials are based on the most recent Mortgage that was taken out on this home.
Original Mortgage
$222,000
Interest Rate
6.17%
Mortgage Type
Purchase Money Mortgage
Purchase Details
Closed on
Mar 6, 2003
Sold by
David Jo-Ann F
Bought by
Oakes Linda L
Home Financials for this Owner
Home Financials are based on the most recent Mortgage that was taken out on this home.
Original Mortgage
$188,720
Interest Rate
5.95%
Mortgage Type
Purchase Money Mortgage
Create a Home Valuation Report for This Property
The Home Valuation Report is an in-depth analysis detailing your home's value as well as a comparison with similar homes in the area
Home Values in the Area
Average Home Value in this Area
Purchase History
| Date | Buyer | Sale Price | Title Company |
|---|---|---|---|
| Neville Michelle T | $277,500 | -- | |
| Oakes Linda L | $235,900 | -- |
Source: Public Records
Mortgage History
| Date | Status | Borrower | Loan Amount |
|---|---|---|---|
| Open | Oakes Linda L | $211,571 | |
| Closed | Oakes Linda L | $222,000 | |
| Previous Owner | Oakes Linda L | $188,720 |
Source: Public Records
Tax History Compared to Growth
Tax History
| Year | Tax Paid | Tax Assessment Tax Assessment Total Assessment is a certain percentage of the fair market value that is determined by local assessors to be the total taxable value of land and additions on the property. | Land | Improvement |
|---|---|---|---|---|
| 2024 | $9,384 | $338,900 | $108,800 | $230,100 |
| 2023 | $9,103 | $338,900 | $108,800 | $230,100 |
| 2022 | $8,774 | $338,900 | $108,800 | $230,100 |
| 2021 | $8,513 | $338,900 | $108,800 | $230,100 |
| 2020 | $8,392 | $313,600 | $87,000 | $226,600 |
| 2019 | $7,762 | $279,400 | $85,300 | $194,100 |
| 2018 | $7,368 | $266,700 | $85,300 | $181,400 |
| 2017 | $7,303 | $258,600 | $85,300 | $173,300 |
| 2016 | $6,715 | $248,100 | $83,700 | $164,400 |
| 2015 | $6,444 | $237,000 | $87,400 | $149,600 |
| 2014 | $6,204 | $237,000 | $87,400 | $149,600 |
| 2013 | -- | $234,100 | $87,400 | $146,700 |
| 2012 | -- | $228,100 | $87,400 | $140,700 |
Source: Public Records
Map
Nearby Homes