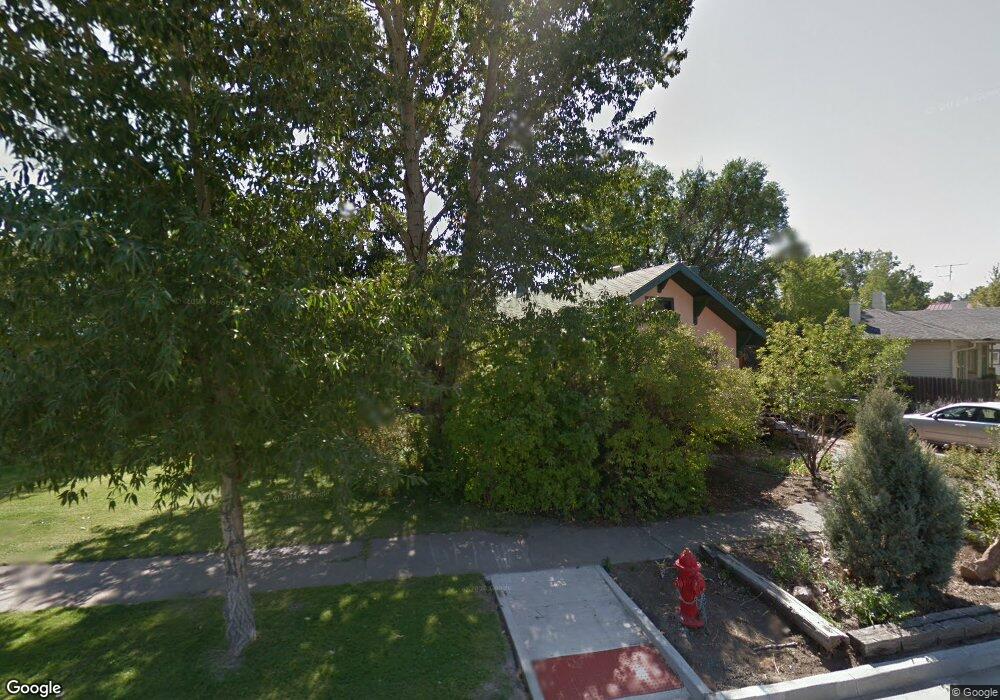
76 Cascade Ave Alamosa, CO 81101
Estimated Value: $256,000 - $321,000
2
Beds
1
Bath
1,525
Sq Ft
$184/Sq Ft
Est. Value
About This Home
This home is located at 76 Cascade Ave, Alamosa, CO 81101 and is currently estimated at $280,356, approximately $183 per square foot. 76 Cascade Ave is a home located in Alamosa County with nearby schools including Alamosa Elementary School, Ortega Middle School, and Alamosa High School.
Ownership History
Date
Name
Owned For
Owner Type
Purchase Details
Closed on
Mar 31, 2009
Sold by
Hartney Karen R
Bought by
Minks Erin G and Hikdner Matthew A
Current Estimated Value
Home Financials for this Owner
Home Financials are based on the most recent Mortgage that was taken out on this home.
Original Mortgage
$122,710
Outstanding Balance
$78,402
Interest Rate
5.14%
Mortgage Type
FHA
Estimated Equity
$201,954
Purchase Details
Closed on
Jun 16, 2005
Sold by
Wilkie Nancy H
Bought by
Hartney Karen R
Purchase Details
Closed on
Feb 23, 1995
Sold by
Anderson Mark Wayne
Bought by
Wilkie Nancy H
Purchase Details
Closed on
May 13, 1994
Sold by
Chapman Ira Brakefield
Bought by
Anderson Mark Wayne
Purchase Details
Closed on
Aug 9, 1993
Sold by
Mcmillen Irene
Bought by
Chapman Ira Brakefield
Purchase Details
Closed on
Oct 23, 1989
Sold by
Schaak Elisa
Bought by
Mcmillen Irene
Purchase Details
Closed on
May 17, 1967
Bought by
Schaak Elisa
Create a Home Valuation Report for This Property
The Home Valuation Report is an in-depth analysis detailing your home's value as well as a comparison with similar homes in the area
Home Values in the Area
Average Home Value in this Area
Purchase History
| Date | Buyer | Sale Price | Title Company |
|---|---|---|---|
| Minks Erin G | $125,000 | None Available | |
| Hartney Karen R | $115,000 | None Available | |
| Wilkie Nancy H | $65,000 | -- | |
| Anderson Mark Wayne | $59,000 | -- | |
| Chapman Ira Brakefield | $40,000 | -- | |
| Mcmillen Irene | -- | -- | |
| Schaak Elisa | -- | -- |
Source: Public Records
Mortgage History
| Date | Status | Borrower | Loan Amount |
|---|---|---|---|
| Open | Minks Erin G | $122,710 |
Source: Public Records
Tax History Compared to Growth
Tax History
| Year | Tax Paid | Tax Assessment Tax Assessment Total Assessment is a certain percentage of the fair market value that is determined by local assessors to be the total taxable value of land and additions on the property. | Land | Improvement |
|---|---|---|---|---|
| 2024 | $868 | $15,426 | $1,759 | $13,667 |
| 2023 | $890 | $15,576 | $1,776 | $13,800 |
| 2022 | $966 | $12,562 | $1,251 | $11,311 |
| 2021 | $989 | $12,506 | $1,251 | $11,255 |
| 2020 | $911 | $12,506 | $1,251 | $11,255 |
| 2019 | $914 | $11,321 | $1,251 | $10,070 |
| 2018 | $847 | $10,307 | $1,260 | $9,047 |
| 2017 | $848 | $10,307 | $1,260 | $9,047 |
| 2016 | $889 | $10,846 | $1,393 | $9,453 |
| 2015 | $888 | $10,846 | $1,393 | $9,453 |
| 2014 | -- | $10,846 | $1,393 | $9,453 |
| 2013 | -- | $10,846 | $1,393 | $9,453 |
Source: Public Records
Map
Nearby Homes
- 631 2nd St
- 735 First St
- 0 Mountain View Blvd Unit 23881373
- 6 Mountain View Place
- Lot 14 Fourth St
- 6 Bellwood Dr
- 24 Alamosa Ave
- 302 Bell Ave
- 61 Conejos Ave
- 0 U S 160
- 1623-B 6th St
- 400 & 406 6th St
- 12 Rio Grande Ave
- 531 Alamosa Ave
- 125 Lots Cottonwoods Phase II
- 1374 N Co Road 110
- 119 Poncha Ave
- 82 Monterey Ave
- 1002 Edison Ave
- 0 McKinney White Pine Unit REC1813333