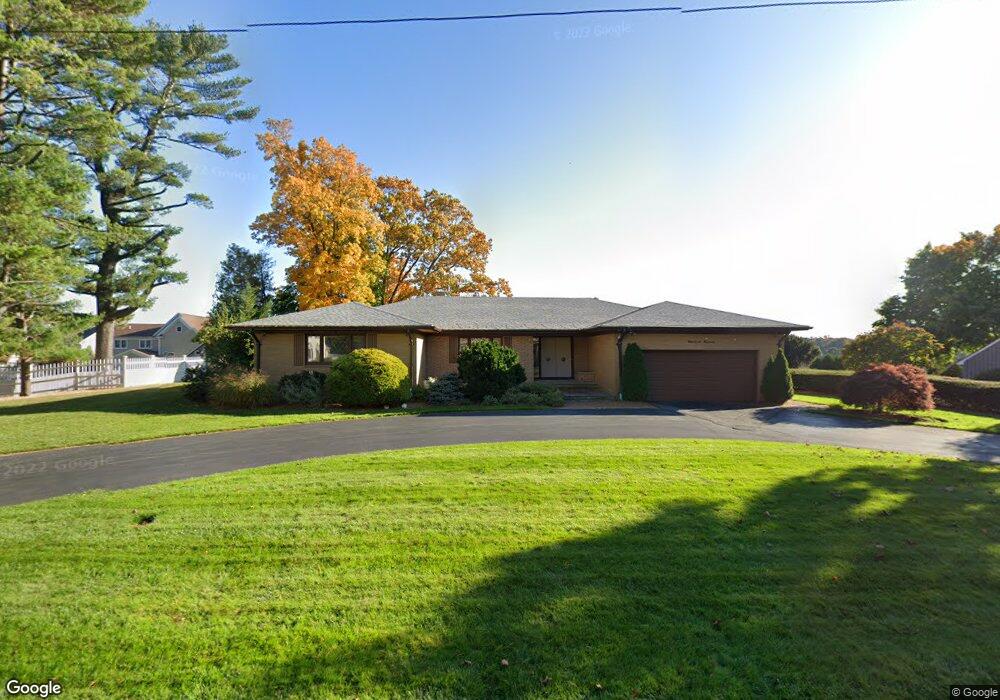
76 Converse St Stoneham, MA 02180
Bear Hill NeighborhoodEstimated Value: $1,273,052 - $1,559,000
3
Beds
4
Baths
3,860
Sq Ft
$350/Sq Ft
Est. Value
About This Home
This home is located at 76 Converse St, Stoneham, MA 02180 and is currently estimated at $1,349,763, approximately $349 per square foot. 76 Converse St is a home located in Middlesex County with nearby schools including Stoneham High School, St Joseph School, and St. Patrick Elementary School.
Ownership History
Date
Name
Owned For
Owner Type
Purchase Details
Closed on
Aug 17, 2015
Sold by
Haley Edward M and Haley Nancy D
Bought by
Nancy Decaro Haley T
Current Estimated Value
Purchase Details
Closed on
Jan 25, 2013
Sold by
Haley Edward M and Haley Nancy D
Bought by
Haley Edward M and Haley Nancy D
Purchase Details
Closed on
Sep 10, 2004
Sold by
In Literary and In Benevolent
Bought by
Haley Edward M and Decaro Nancy C
Create a Home Valuation Report for This Property
The Home Valuation Report is an in-depth analysis detailing your home's value as well as a comparison with similar homes in the area
Home Values in the Area
Average Home Value in this Area
Purchase History
| Date | Buyer | Sale Price | Title Company |
|---|---|---|---|
| Nancy Decaro Haley T | -- | -- | |
| Haley Edward M | -- | -- | |
| Haley Edward M | $14,284 | -- |
Source: Public Records
Tax History
| Year | Tax Paid | Tax Assessment Tax Assessment Total Assessment is a certain percentage of the fair market value that is determined by local assessors to be the total taxable value of land and additions on the property. | Land | Improvement |
|---|---|---|---|---|
| 2025 | $11,627 | $1,136,600 | $442,700 | $693,900 |
| 2024 | $11,450 | $1,081,200 | $402,700 | $678,500 |
| 2023 | $11,302 | $1,018,200 | $362,700 | $655,500 |
| 2022 | $10,099 | $970,100 | $342,700 | $627,400 |
| 2021 | $10,043 | $928,200 | $332,700 | $595,500 |
| 2020 | $9,874 | $915,100 | $322,700 | $592,400 |
| 2019 | $62 | $854,400 | $322,700 | $531,700 |
| 2018 | $9,391 | $802,000 | $302,700 | $499,300 |
| 2017 | $9,480 | $765,100 | $292,700 | $472,400 |
| 2016 | $9,421 | $741,800 | $282,700 | $459,100 |
| 2015 | $8,894 | $686,300 | $262,700 | $423,600 |
| 2014 | $8,906 | $660,200 | $262,700 | $397,500 |
Source: Public Records
Map
Nearby Homes
- 4 Adams St
- 95 Prospect St
- 62 High St Unit Lot 8
- 62 High St Unit 4
- 62 High St Unit Lot 5
- 62 High St Unit Lot 12
- 55 Bartley St
- 248 Albion St Unit 231
- 248 Albion St Unit 321
- 64 Main St Unit 24B
- 66 Main St Unit 15A
- 12 Isola Ln
- 68 Main St Unit 21C
- 98 Main St Unit 2
- 8 Steele St
- 3 Valley Rd
- 1 Summit Dr Unit 57
- 69 Foundry St Unit 310
- 69 Foundry St Unit 416
- 311 Gazebo Cir Unit 311
Your Personal Tour Guide
Ask me questions while you tour the home.