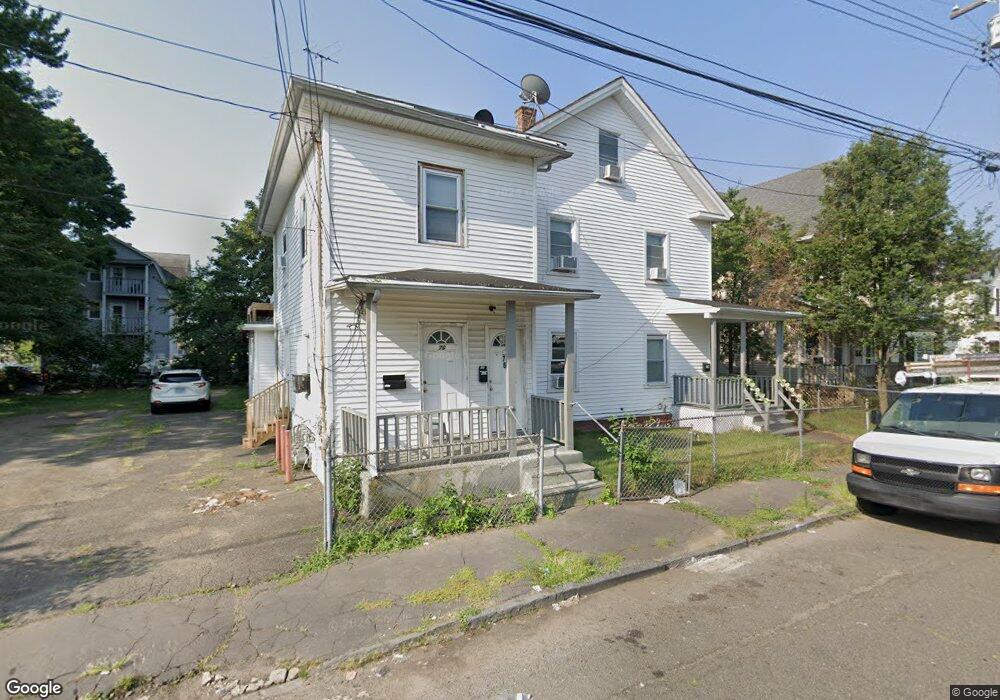
76 Deforest Ave Unit 1 Bridgeport, CT 06607
East End NeighborhoodEstimated Value: $332,208 - $545,000
1
Bed
1
Bath
837
Sq Ft
$528/Sq Ft
Est. Value
About This Home
This home is located at 76 Deforest Ave Unit 1, Bridgeport, CT 06607 and is currently estimated at $441,552, approximately $527 per square foot. 76 Deforest Ave Unit 1 is a home located in Fairfield County with nearby schools including Dunbar School, Harding High School, and The Bridge Academy.
Ownership History
Date
Name
Owned For
Owner Type
Purchase Details
Closed on
Oct 27, 2003
Sold by
Thompson Ervin M
Bought by
Stephens Samuel
Current Estimated Value
Purchase Details
Closed on
Jan 2, 2001
Sold by
Centex Home Equity
Bought by
Thompson Ervin M
Purchase Details
Closed on
Jul 10, 2000
Sold by
Mitchell Cheryl
Bought by
Center Home Equity
Purchase Details
Closed on
Dec 30, 1999
Sold by
Mitchell Cheryl
Bought by
Associates He Svcs
Purchase Details
Closed on
Jun 18, 1998
Sold by
Valerio Restituto
Bought by
Mitchell Cheryl
Purchase Details
Closed on
Jun 2, 1997
Sold by
Allen James
Bought by
Valerio Restituto
Purchase Details
Closed on
May 29, 1997
Sold by
Framularo Charles V
Bought by
Allen James
Create a Home Valuation Report for This Property
The Home Valuation Report is an in-depth analysis detailing your home's value as well as a comparison with similar homes in the area
Home Values in the Area
Average Home Value in this Area
Purchase History
| Date | Buyer | Sale Price | Title Company |
|---|---|---|---|
| Stephens Samuel | $185,000 | -- | |
| Stephens Samuel | $185,000 | -- | |
| Thompson Ervin M | $48,000 | -- | |
| Thompson Ervin M | $48,000 | -- | |
| Center Home Equity | $67,500 | -- | |
| Center Home Equity | $67,500 | -- | |
| Associates He Svcs | $56,654 | -- | |
| Mitchell Cheryl | $75,000 | -- | |
| Mitchell Cheryl | $75,000 | -- | |
| Valerio Restituto | $73,000 | -- | |
| Valerio Restituto | $73,000 | -- | |
| Allen James | $35,000 | -- | |
| Allen James | $35,000 | -- |
Source: Public Records
Mortgage History
| Date | Status | Borrower | Loan Amount |
|---|---|---|---|
| Closed | Allen James | $110,000 | |
| Open | Allen James | $218,000 |
Source: Public Records
Tax History Compared to Growth
Tax History
| Year | Tax Paid | Tax Assessment Tax Assessment Total Assessment is a certain percentage of the fair market value that is determined by local assessors to be the total taxable value of land and additions on the property. | Land | Improvement |
|---|---|---|---|---|
| 2025 | $6,663 | $153,360 | $36,220 | $117,140 |
| 2024 | $6,663 | $153,360 | $36,220 | $117,140 |
| 2023 | $6,663 | $153,360 | $36,220 | $117,140 |
| 2022 | $6,663 | $153,360 | $36,220 | $117,140 |
| 2021 | $6,663 | $153,360 | $36,220 | $117,140 |
| 2020 | $6,342 | $117,470 | $20,250 | $97,220 |
| 2019 | $6,342 | $117,470 | $20,250 | $97,220 |
| 2018 | $6,387 | $117,470 | $20,250 | $97,220 |
| 2017 | $6,387 | $117,470 | $20,250 | $97,220 |
| 2016 | $6,387 | $117,470 | $20,250 | $97,220 |
| 2015 | $6,915 | $163,860 | $34,730 | $129,130 |
| 2014 | $6,915 | $163,860 | $34,730 | $129,130 |
Source: Public Records
Map
Nearby Homes
- 55 Deforest Ave
- 376 Seaview Ave
- 194 Adams St
- 325 Jefferson St
- 800 Seaview Ave Unit 790-3
- 205 Smith St
- 520 Seaview Ave
- 93 Clifford St
- 643 Newfield Ave Unit 645
- 40 5th St
- 320 Union Ave
- 54 6th St
- 408 Union Ave
- 49 Bunnell St Unit 51
- 306 Carroll Ave
- 363 Carroll Ave Unit 365
- 445 Nichols St
- 1440 Stratford Ave
- 221 Bunnell St
- 247 6th St
- 76 Deforest Ave
- 62 Deforest Ave Unit 64
- 137 Newfield Ave
- 64 Deforest Ave Unit 1
- 63 Dekalb Ave
- 75-77 Dekalb Ave
- 47-49 Dekalb Ave
- 49 Dekalb Ave
- 83 Deforest Ave
- 55 Dekalb Ave Unit 57
- 75 Dekalb Ave Unit 77
- 145 Newfield Ave Unit 147
- 145 Newfield Ave Unit 1st.
- 61 Deforest Ave
- 147 Newfield Ave Unit 3rd.Fl
- 147 Newfield Ave Unit 2nd.
- 147 Newfield Ave Unit 3rd.
- 47 Dekalb Ave Unit 49
- 47 Dekalb Ave Unit 1ST F
- 47 Dekalb Ave Unit 2nd f