76 Derby Rd Melrose, MA 02176
Oak Grove-Pine Banks NeighborhoodEstimated Value: $742,000 - $971,448
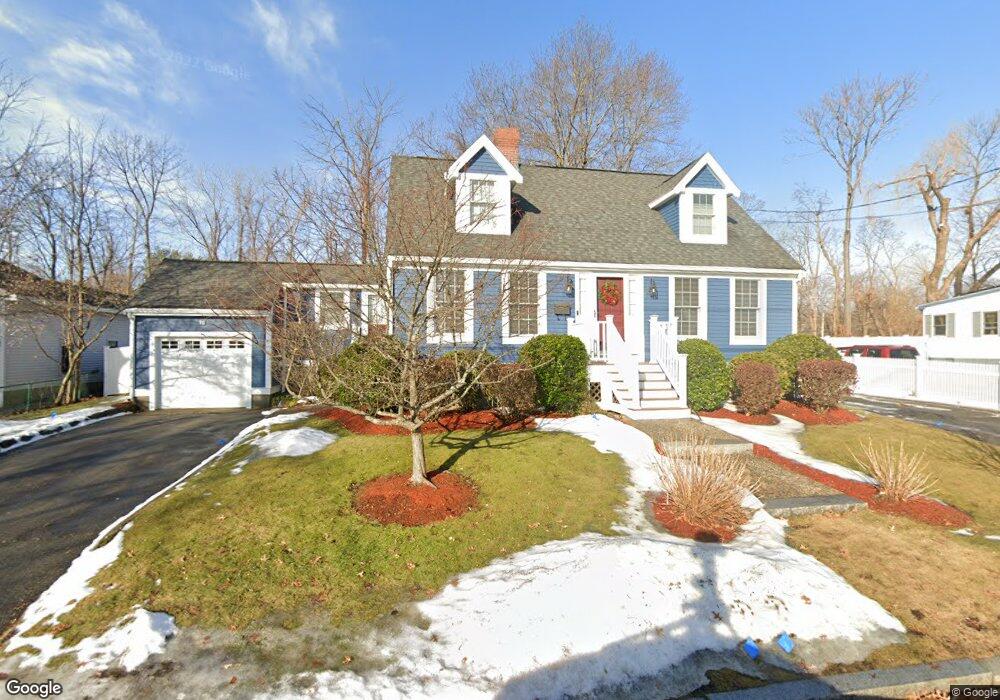
About This Home
This home is located at 76 Derby Rd, Melrose, MA 02176 and is currently estimated at $867,612, approximately $617 per square foot. 76 Derby Rd is a home located in Middlesex County with nearby schools including Lincoln Elementary School, Hoover Elementary School, and Winthrop Elementary School.
Ownership History
We collect this data history from publicly available records. To have your information removed, we recommend requesting removal directly through your county’s website.
Purchase Details
Home Financials for this Owner
Home Financials are based on the most recent Mortgage that was taken out on this home.Purchase Details
Home Values in the Area
Average Home Value in this Area
Purchase History
We collect this data history from publicly available records. To have your information removed, we recommend requesting removal directly through your county’s website.
| Date | Buyer | Sale Price | Title Company |
|---|---|---|---|
| $415,000 | -- | ||
| $415,000 | -- | ||
| $299,900 | -- | ||
| $299,900 | -- |
Mortgage History
We collect this data history from publicly available records. To have your information removed, we recommend requesting removal directly through your county’s website.
| Date | Status | Borrower | Loan Amount |
|---|---|---|---|
| Open | $409,485 | ||
| Closed | $409,485 |
Tax History
We collect this data history from publicly available records. To have your information removed, we recommend requesting removal directly through your county’s website.
| Year | Tax Paid | Tax Assessment Tax Assessment Total Assessment is a certain percentage of the fair market value that is determined by local assessors to be the total taxable value of land and additions on the property. | Land | Improvement |
|---|---|---|---|---|
| 2025 | $8,159 | $824,100 | $411,300 | $412,800 |
| 2024 | $7,779 | $783,400 | $384,700 | $398,700 |
| 2023 | $7,630 | $732,200 | $358,200 | $374,000 |
| 2022 | $7,090 | $670,800 | $308,600 | $362,200 |
| 2021 | $6,892 | $629,400 | $296,800 | $332,600 |
| 2020 | $6,696 | $606,000 | $273,000 | $333,000 |
| 2019 | $6,041 | $558,800 | $261,100 | $297,700 |
| 2018 | $5,827 | $514,300 | $216,600 | $297,700 |
| 2017 | $5,685 | $481,800 | $207,700 | $274,100 |
| 2016 | $5,467 | $443,400 | $184,000 | $259,400 |
| 2015 | $5,351 | $412,900 | $184,000 | $228,900 |
| 2014 | $5,287 | $398,100 | $169,200 | $228,900 |
Map
- 207-209 Main St
- 242 Pleasant St
- 171 Derby Rd
- 6 Black Rock Rd
- 265 Main St
- 35 Frances St
- 509 Pleasant St Unit 1-4
- 14 Rockwood St
- 26 W Wyoming Ave Unit 2D
- 110 Crescent Ave
- 340 Main St Unit 301
- 340 Main St Unit 606
- 15 Berwick St
- 43 Trenton St
- 97 Trenton St
- 63 Florence St
- 38-40 Hurd St
- 59 Mystic Ave
- 28 Edgemere St
- 350 Washington St
Ask me questions while you tour the home.