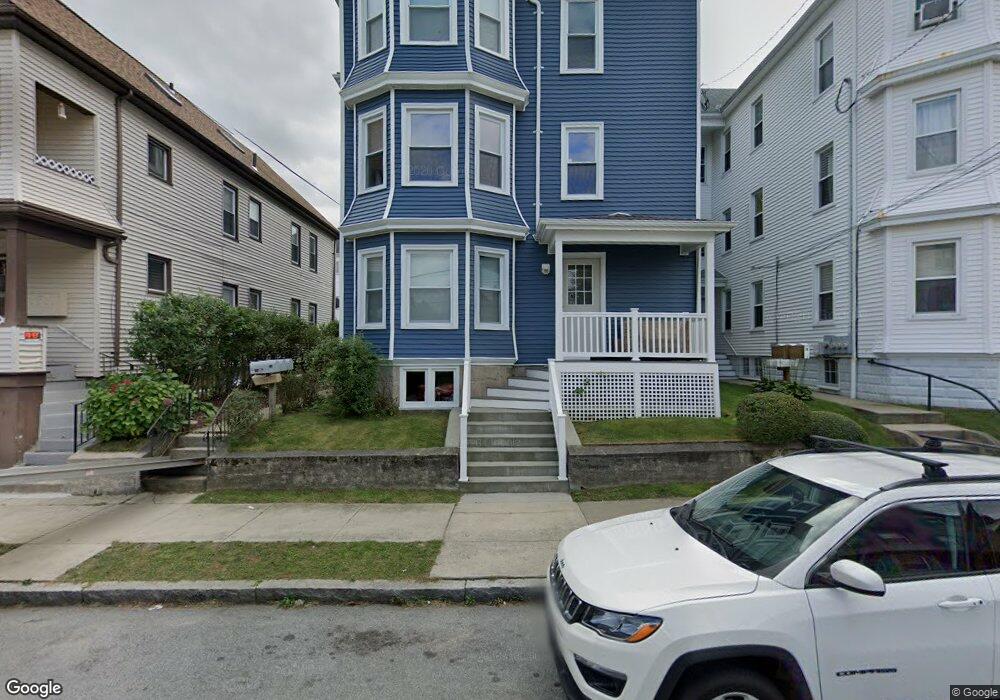
76 Dunbar St New Bedford, MA 02740
The South End NeighborhoodEstimated Value: $416,050 - $682,000
9
Beds
3
Baths
3,501
Sq Ft
$170/Sq Ft
Est. Value
About This Home
This home is located at 76 Dunbar St, New Bedford, MA 02740 and is currently estimated at $595,513, approximately $170 per square foot. 76 Dunbar St is a home located in Bristol County with nearby schools including John B. DeValles Elementary School, Roosevelt Middle School, and New Bedford High School.
Ownership History
Date
Name
Owned For
Owner Type
Purchase Details
Closed on
Nov 23, 2004
Sold by
Vieira Norma D Est
Bought by
Perry Richard M and Perry Suzanne T
Current Estimated Value
Home Financials for this Owner
Home Financials are based on the most recent Mortgage that was taken out on this home.
Original Mortgage
$187,000
Outstanding Balance
$93,443
Interest Rate
5.8%
Mortgage Type
Purchase Money Mortgage
Estimated Equity
$502,070
Create a Home Valuation Report for This Property
The Home Valuation Report is an in-depth analysis detailing your home's value as well as a comparison with similar homes in the area
Home Values in the Area
Average Home Value in this Area
Purchase History
| Date | Buyer | Sale Price | Title Company |
|---|---|---|---|
| Perry Richard M | $220,000 | -- | |
| Perry Richard M | $220,000 | -- |
Source: Public Records
Mortgage History
| Date | Status | Borrower | Loan Amount |
|---|---|---|---|
| Open | Perry Richard M | $187,000 | |
| Closed | Perry Richard M | $187,000 |
Source: Public Records
Tax History Compared to Growth
Tax History
| Year | Tax Paid | Tax Assessment Tax Assessment Total Assessment is a certain percentage of the fair market value that is determined by local assessors to be the total taxable value of land and additions on the property. | Land | Improvement |
|---|---|---|---|---|
| 2025 | $5,709 | $504,800 | $89,800 | $415,000 |
| 2024 | $5,267 | $438,900 | $86,600 | $352,300 |
| 2023 | $4,749 | $332,300 | $72,500 | $259,800 |
| 2022 | $4,395 | $282,800 | $70,600 | $212,200 |
| 2021 | $4,244 | $272,200 | $67,400 | $204,800 |
| 2020 | $4,226 | $261,500 | $67,400 | $194,100 |
| 2019 | $3,088 | $221,300 | $67,400 | $153,900 |
| 2018 | $3,469 | $208,600 | $67,400 | $141,200 |
| 2017 | $3,240 | $194,100 | $69,000 | $125,100 |
| 2016 | $3,112 | $188,700 | $69,000 | $119,700 |
| 2015 | $2,902 | $184,500 | $69,000 | $115,500 |
| 2014 | $2,797 | $184,500 | $69,000 | $115,500 |
Source: Public Records
Map
Nearby Homes
- 76 Dunbar St Unit 2nd Floor
- 78 Dunbar St
- 72 Dunbar St Unit 74
- 80 Dunbar St Unit 82
- 71 Sidney St
- 67 Sidney St
- 77 Sidney St
- 155 Hemlock St
- 157 Hemlock St
- 73 Dunbar St
- 73 Dunbar St Unit 1
- 84 Dunbar St
- 159 Hemlock St
- 77 Dunbar St
- 81 Dunbar St
- 151 Hemlock St Unit 153
- 83 Dunbar St
- 92 Dunbar St
- 92 Dunbar St Unit 2
- 76 Swift St