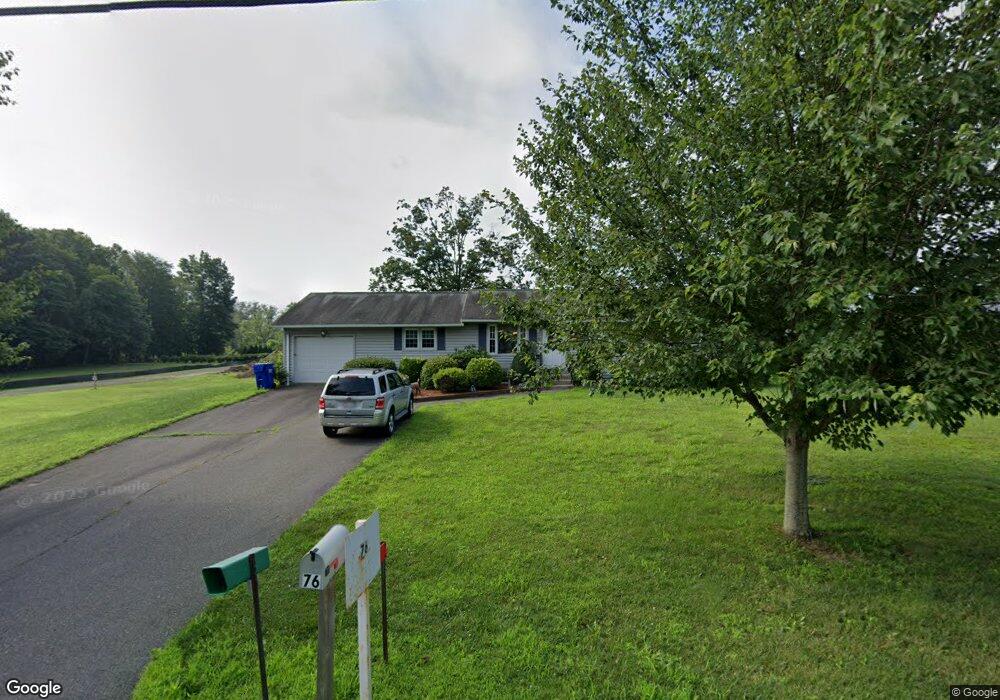
76 Dwight St Hatfield, MA 01038
Estimated Value: $372,000 - $425,580
3
Beds
2
Baths
1,306
Sq Ft
$305/Sq Ft
Est. Value
About This Home
This home is located at 76 Dwight St, Hatfield, MA 01038 and is currently estimated at $397,895, approximately $304 per square foot. 76 Dwight St is a home located in Hampshire County with nearby schools including Hatfield Elementary School, Smith Academy, and The Montessori School of Northampton.
Ownership History
Date
Name
Owned For
Owner Type
Purchase Details
Closed on
Jun 28, 2018
Sold by
Lacey Theresa M
Bought by
Lacey Wayne E and Lacey William J
Current Estimated Value
Purchase Details
Closed on
Jun 18, 2008
Sold by
Lacey Wayne E
Bought by
Lacey Theresa M and Lacey Wayne E
Purchase Details
Closed on
Sep 18, 2007
Sold by
Lacey Theresa M and Lacey Wayne E
Bought by
Lacey John P
Create a Home Valuation Report for This Property
The Home Valuation Report is an in-depth analysis detailing your home's value as well as a comparison with similar homes in the area
Home Values in the Area
Average Home Value in this Area
Purchase History
| Date | Buyer | Sale Price | Title Company |
|---|---|---|---|
| Lacey Wayne E | -- | -- | |
| Lacey Theresa M | -- | -- | |
| Lacey John P | -- | -- | |
| Lacey William J | -- | -- | |
| Lacey Wayne E | -- | -- |
Source: Public Records
Tax History
| Year | Tax Paid | Tax Assessment Tax Assessment Total Assessment is a certain percentage of the fair market value that is determined by local assessors to be the total taxable value of land and additions on the property. | Land | Improvement |
|---|---|---|---|---|
| 2025 | $4,993 | $360,800 | $146,500 | $214,300 |
| 2024 | $4,795 | $313,200 | $127,600 | $185,600 |
| 2023 | $3,989 | $295,900 | $121,400 | $174,500 |
| 2022 | $3,778 | $276,400 | $115,100 | $161,300 |
| 2021 | $3,604 | $254,000 | $104,600 | $149,400 |
| 2020 | $3,437 | $254,000 | $104,600 | $149,400 |
| 2019 | $3,322 | $239,200 | $102,500 | $136,700 |
| 2018 | $3,213 | $236,600 | $102,500 | $134,100 |
| 2017 | $3,111 | $235,300 | $102,500 | $132,800 |
| 2016 | $3,101 | $235,300 | $102,500 | $132,800 |
| 2015 | $2,991 | $227,100 | $92,100 | $135,000 |
| 2014 | $2,891 | $228,200 | $92,100 | $136,100 |
Source: Public Records
Map
Nearby Homes
- 12 Dwight St
- 18 Elm St
- 32 Stonewall Dr
- 182 Old Stage Rd
- 0 Pantry Rd Unit 73430264
- 0 Straits Rd
- 58 Main St Unit 4
- 58 Main St Unit 3
- 88 Pines Edge Dr Unit 88
- 80 Damon Rd Unit 5104
- 80 Damon Rd Unit 4302
- 289 Hatfield St
- 0 N Branch Rd
- 11 West St
- 26 Russell St Unit A-B
- 151 Pantry Rd
- 35 Hubbard Ave
- 575 Bridge Rd Unit 12-7
- 575 Bridge Rd Unit 10-5
- 0 Terrace Ln
- 74 Dwight St
- 72 Dwight St
- 70 Dwight St
- 113 Bridge St
- 68 Dwight St
- 62 Dwight St
- PAR 3 Scotland Rd
- LOT #2 Straits Rd
- LOT 3 Mountain Rd
- 54 Dwight St
- 3 Church Ave
- 52 Dwight St
- 6 Church Ave
- 6 Church Ave Unit C
- 6 Church Ave Unit F
- 6 Church Ave Unit D
- 6 Church Ave Unit E
- 7 Church Ave
- 22 West St Unit B
- 22 West St
Your Personal Tour Guide
Ask me questions while you tour the home.