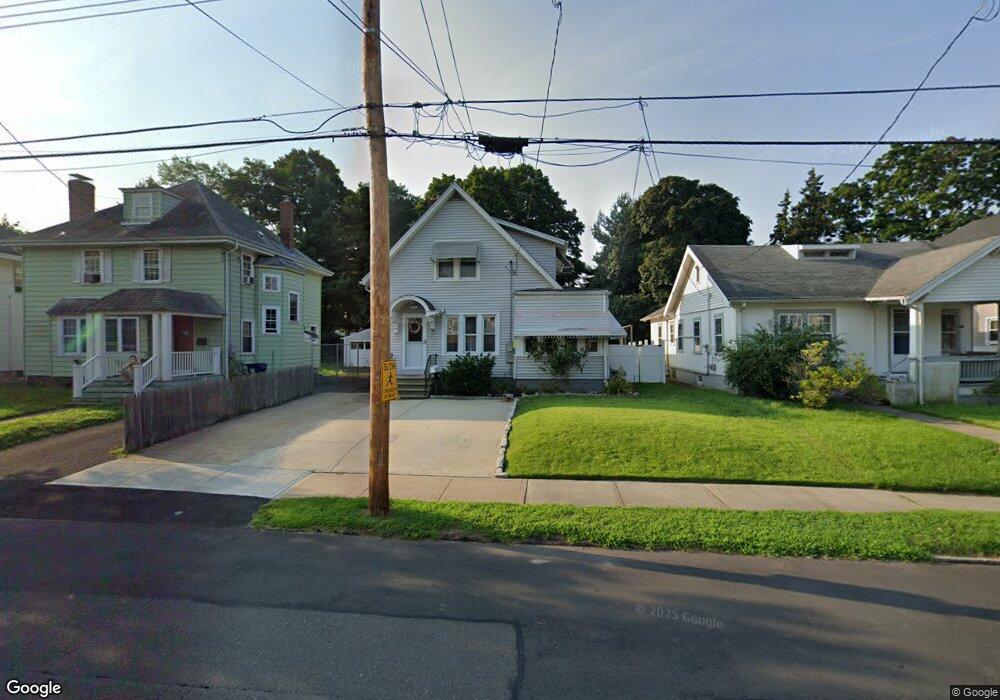
76 E Brown St West Haven, CT 06516
West Haven Center NeighborhoodEstimated Value: $327,765 - $391,000
2
Beds
1
Bath
1,251
Sq Ft
$276/Sq Ft
Est. Value
About This Home
This home is located at 76 E Brown St, West Haven, CT 06516 and is currently estimated at $345,441, approximately $276 per square foot. 76 E Brown St is a home located in New Haven County with nearby schools including Carrigan 5/6 Intermediate School, Harry M. Bailey Middle School, and West Haven High School.
Ownership History
Date
Name
Owned For
Owner Type
Purchase Details
Closed on
Apr 14, 2011
Sold by
Fnma
Bought by
Baker Jamie L
Current Estimated Value
Home Financials for this Owner
Home Financials are based on the most recent Mortgage that was taken out on this home.
Original Mortgage
$116,150
Interest Rate
4.89%
Mortgage Type
Purchase Money Mortgage
Purchase Details
Closed on
Nov 17, 2010
Sold by
Hsbc Mortgage Svcs Inc
Bought by
Federal National Mortgage Association
Purchase Details
Closed on
May 1, 1998
Sold by
Magri Mark R and Magri Mary C
Bought by
Aquilante Frank A and Aquilante Marietta
Purchase Details
Closed on
Jul 30, 1990
Sold by
Everett William E
Bought by
Galligan Joseph F
Create a Home Valuation Report for This Property
The Home Valuation Report is an in-depth analysis detailing your home's value as well as a comparison with similar homes in the area
Home Values in the Area
Average Home Value in this Area
Purchase History
| Date | Buyer | Sale Price | Title Company |
|---|---|---|---|
| Baker Jamie L | $95,000 | -- | |
| Federal National Mortgage Association | -- | -- | |
| Hsbc Mortgage Svcs Inc | -- | -- | |
| Aquilante Frank A | $95,000 | -- | |
| Baker Jamie L | $95,000 | -- | |
| Federal National Mortgage Association | -- | -- | |
| Aquilante Frank A | $95,000 | -- | |
| Galligan Joseph F | $131,000 | -- |
Source: Public Records
Mortgage History
| Date | Status | Borrower | Loan Amount |
|---|---|---|---|
| Open | Galligan Joseph F | $107,000 | |
| Closed | Galligan Joseph F | $116,150 |
Source: Public Records
Tax History
| Year | Tax Paid | Tax Assessment Tax Assessment Total Assessment is a certain percentage of the fair market value that is determined by local assessors to be the total taxable value of land and additions on the property. | Land | Improvement |
|---|---|---|---|---|
| 2025 | $7,546 | $218,540 | $71,260 | $147,280 |
| 2024 | $6,575 | $135,520 | $49,350 | $86,170 |
| 2023 | $6,303 | $135,520 | $49,350 | $86,170 |
| 2022 | $6,180 | $135,520 | $49,350 | $86,170 |
| 2021 | $6,180 | $135,520 | $49,350 | $86,170 |
| 2020 | $5,886 | $116,620 | $45,150 | $71,470 |
| 2019 | $5,676 | $116,620 | $45,150 | $71,470 |
| 2018 | $5,627 | $116,620 | $45,150 | $71,470 |
| 2017 | $5,325 | $116,620 | $45,150 | $71,470 |
| 2016 | $5,313 | $116,620 | $45,150 | $71,470 |
| 2015 | $5,206 | $129,010 | $49,980 | $79,030 |
| 2014 | $5,173 | $129,010 | $49,980 | $79,030 |
Source: Public Records
Map
Nearby Homes
Your Personal Tour Guide
Ask me questions while you tour the home.