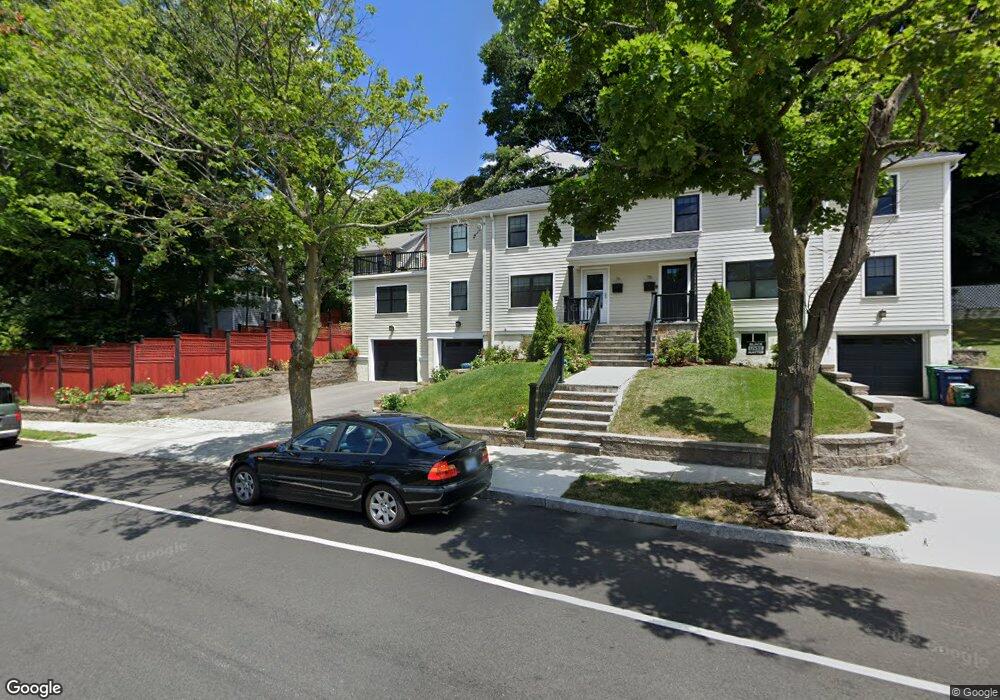
76 E Side Pkwy Unit 78 Newton, MA 02458
Newton Corner NeighborhoodEstimated Value: $1,064,284 - $1,463,000
3
Beds
2
Baths
1,722
Sq Ft
$716/Sq Ft
Est. Value
About This Home
This home is located at 76 E Side Pkwy Unit 78, Newton, MA 02458 and is currently estimated at $1,233,571, approximately $716 per square foot. 76 E Side Pkwy Unit 78 is a home located in Middlesex County with nearby schools including Cabot Elementary School, F.A. Day Middle School, and Newton North High School.
Ownership History
Date
Name
Owned For
Owner Type
Purchase Details
Closed on
Sep 10, 2021
Sold by
Michael Mufson Ret
Bought by
Mufson Ariana S
Current Estimated Value
Purchase Details
Closed on
Aug 10, 2018
Sold by
Mufson Michael
Bought by
199 Michael Mufson Ret
Purchase Details
Closed on
Jul 27, 2017
Sold by
Bernson Dana L
Bought by
201 Dana L Barnson Ret
Purchase Details
Closed on
Nov 7, 2007
Sold by
Kachadurian K
Bought by
K & K Realty Llc
Create a Home Valuation Report for This Property
The Home Valuation Report is an in-depth analysis detailing your home's value as well as a comparison with similar homes in the area
Home Values in the Area
Average Home Value in this Area
Purchase History
| Date | Buyer | Sale Price | Title Company |
|---|---|---|---|
| Mufson Ariana S | -- | None Available | |
| Mufson Ariana S | -- | None Available | |
| 199 Michael Mufson Ret | -- | -- | |
| Michael Mufson Ret 199 | -- | -- | |
| 201 Dana L Barnson Ret | -- | -- | |
| Dana L Barnson Ret 201 L | -- | -- | |
| K & K Realty Llc | -- | -- | |
| K & K Realty Llc | -- | -- |
Source: Public Records
Mortgage History
| Date | Status | Borrower | Loan Amount |
|---|---|---|---|
| Previous Owner | K & K Realty Llc | $350,000 | |
| Previous Owner | K & K Realty Llc | $203,000 |
Source: Public Records
Tax History Compared to Growth
Tax History
| Year | Tax Paid | Tax Assessment Tax Assessment Total Assessment is a certain percentage of the fair market value that is determined by local assessors to be the total taxable value of land and additions on the property. | Land | Improvement |
|---|---|---|---|---|
| 2025 | $9,932 | $1,013,500 | $0 | $1,013,500 |
| 2024 | $9,604 | $984,000 | $0 | $984,000 |
| 2023 | $9,408 | $924,200 | $0 | $924,200 |
| 2022 | $9,260 | $880,200 | $0 | $880,200 |
| 2021 | $8,935 | $830,400 | $0 | $830,400 |
| 2020 | $8,669 | $830,400 | $0 | $830,400 |
| 2019 | $8,425 | $806,200 | $0 | $806,200 |
| 2018 | $8,871 | $819,900 | $0 | $819,900 |
| 2017 | $9,105 | $818,800 | $482,500 | $336,300 |
| 2016 | $8,039 | $706,400 | $442,700 | $263,700 |
| 2015 | $7,665 | $660,200 | $413,700 | $246,500 |
Source: Public Records
Map
Nearby Homes
- 324 Adams St Unit 2
- 48 Harvard St Unit 1
- 14 Summit St
- 110 Harvard St Unit A
- 10 Washington Park
- 10 Washington Park Unit 2
- 10 Washington Park Unit 1
- 44 Blake St Unit 2
- 22-24 Emerald St
- 12-14 Middle St
- 300 Cabot St
- 127-129 Withington Rd Unit 1
- 90 Waban Park Unit 2
- 3 Ashmont Ave
- 11 Murphy Ct
- 86 West St
- 686 Centre St
- 642 Centre St
- 49 Hawthorn St
- 35 George St Unit 35
- 76 E Side Pkwy Unit 76
- 78 E Side Pkwy
- 31 Lewis St
- 29 Lewis St
- 84 E Side Pkwy
- 84 E Side Pkwy Unit 2
- 25 Lewis St Unit 27
- 25-27 Lewis St
- 27 Lewis Unit 2
- 82-84 E Side Pkwy
- 82 E Side Pkwy Unit 84
- 37 Lewis St Unit 2
- 37 Lewis St
- 35 Lewis St Unit 37
- 35 Lewis St Unit 1
- 19 Lewis St
- 88 E Side Pkwy
- 90 E Side Pkwy Unit 2
- 88 E Side Pkwy Unit 2
- 94 E Side Pkwy Unit 94