W
Landlord's Agent in 2025
Winner Yam McDonald
William Raveis R.E. & Home Services
(617) 875-2868
7 in this area
33 Total Sales

Estimated Value: $784,000 - $823,000
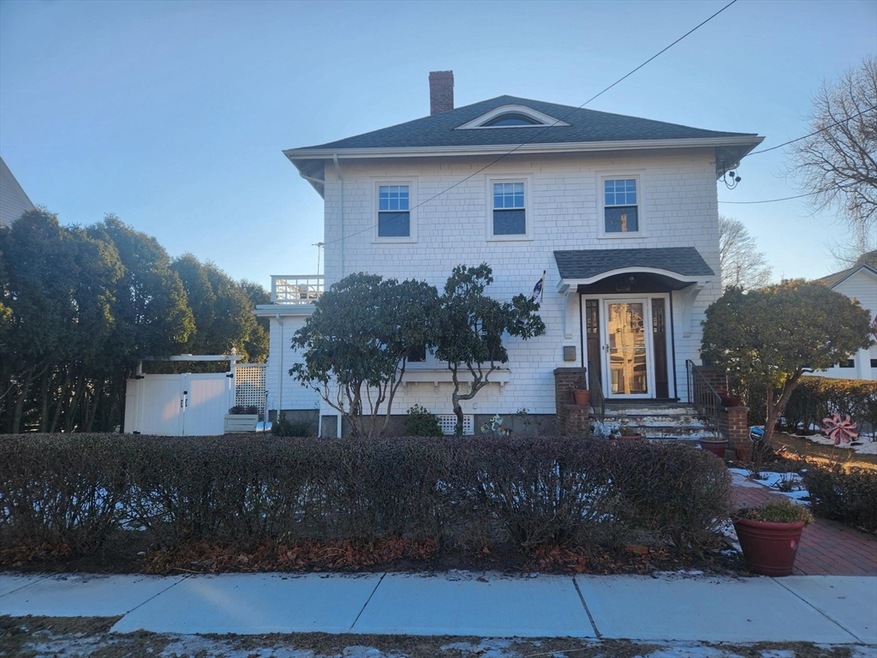
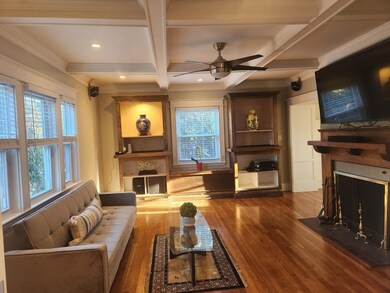
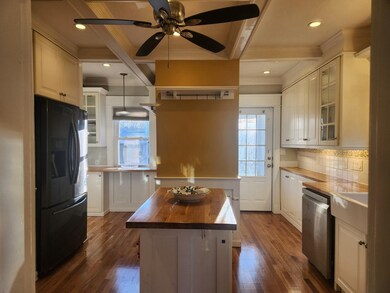
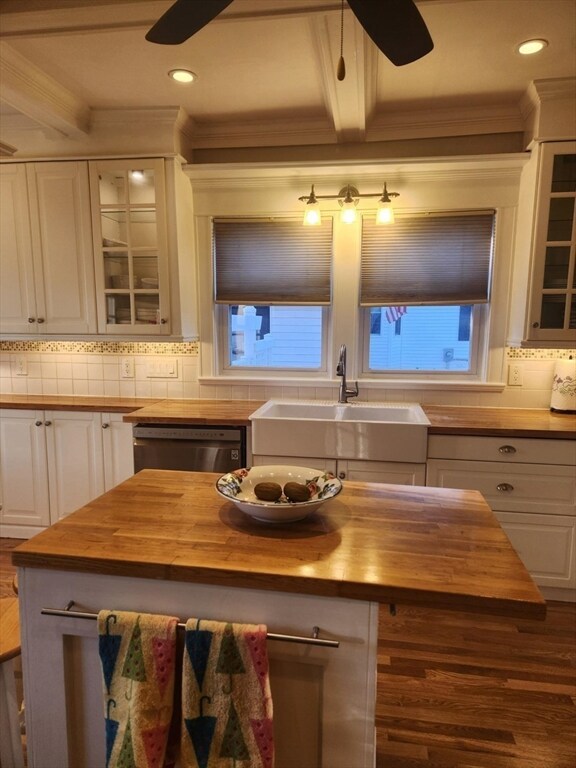
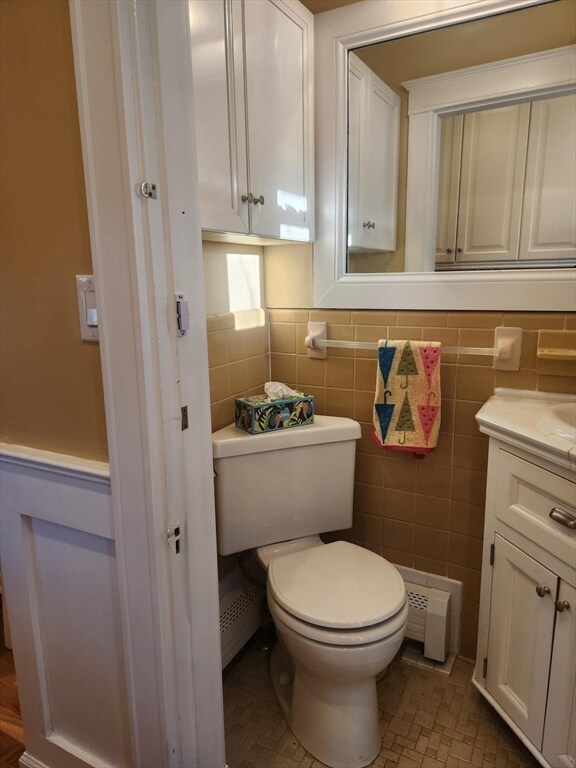
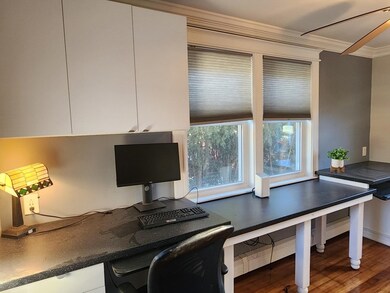
This charming 4-bedroom, 1.5 bath colonial Single home is located in one of Quincy's finest neighborhoods, just a short walk to vibrant Quincy Center and the T station. The home boasts gleaming hardwood floors, custom crown molding, and natural woodwork, adding timeless character and elegance. Enjoy a spacious layout, including a large living room, formal dining room with a custom hutch, and a kitchen with all necessary appliances. Additional features include a walk-up attic with a heated bedroom and storage, and a two-car garage with an electric overhead door. The private backyard offers a peaceful retreat. Easy access to Quincy Center, the Red Line T, YMCA, Tennis & Track, and restaurants. One month security, and one-month rental fee split 50/50 with listing and rental agent. No pets or smoking. Good credit and references required. Available immediately. 2/16/2025 OPEN HOUSE CANCELLED DUE TO WEATHER CONDITION! Sorry for any inconvenience!!!
Last Agent to Rent the Property
William Raveis R.E. & Home Services Listed on: 02/08/2025

| Date | Buyer | Sale Price | Title Company |
|---|---|---|---|
| Abundis Celia | $412,000 | -- | |
| Abundis Celia | $412,000 | -- |
| Date | Status | Borrower | Loan Amount |
|---|---|---|---|
| Open | Abundis Celia | $319,400 | |
| Closed | Abundis Celia | $329,600 |
| Date | Event | Price | List to Sale | Price per Sq Ft | Prior Sale |
|---|---|---|---|---|---|
| 03/05/2025 03/05/25 | Rented | $4,000 | 0.0% | -- | |
| 02/28/2025 02/28/25 | Under Contract | -- | -- | -- | |
| 02/12/2025 02/12/25 | For Rent | $4,000 | 0.0% | -- | |
| 02/10/2025 02/10/25 | Off Market | $4,000 | -- | -- | |
| 02/08/2025 02/08/25 | For Rent | $4,000 | 0.0% | -- | |
| 11/26/2024 11/26/24 | Sold | $806,888 | +7.6% | $390 / Sq Ft | View Prior Sale |
| 10/13/2024 10/13/24 | Pending | -- | -- | -- | |
| 10/08/2024 10/08/24 | For Sale | $749,900 | -- | $363 / Sq Ft |
| Year | Tax Paid | Tax Assessment Tax Assessment Total Assessment is a certain percentage of the fair market value that is determined by local assessors to be the total taxable value of land and additions on the property. | Land | Improvement |
|---|---|---|---|---|
| 2025 | $8,727 | $756,900 | $281,700 | $475,200 |
| 2024 | $6,914 | $613,500 | $268,300 | $345,200 |
| 2023 | $6,291 | $565,200 | $243,900 | $321,300 |
| 2022 | $6,290 | $525,000 | $221,700 | $303,300 |
| 2021 | $6,236 | $513,700 | $221,700 | $292,000 |
| 2020 | $6,104 | $491,100 | $211,200 | $279,900 |
| 2019 | $5,850 | $466,100 | $199,200 | $266,900 |
| 2018 | $5,948 | $445,900 | $199,200 | $246,700 |
| 2017 | $5,858 | $413,400 | $189,800 | $223,600 |
| 2016 | $5,586 | $389,000 | $180,700 | $208,300 |
| 2015 | $5,428 | $371,800 | $180,700 | $191,100 |
| 2014 | $5,173 | $348,100 | $172,100 | $176,000 |
W
Landlord's Agent in 2025
Winner Yam McDonald
William Raveis R.E. & Home Services
(617) 875-2868
7 in this area
33 Total Sales
Seller's Agent in 2024
Hillary Birch
Compass
(781) 608-1425
15 in this area
102 Total Sales
Source: MLS Property Information Network (MLS PIN)
MLS Number: 73333665
APN: QUIN-001114H-000005-000023
Disclaimer: Certain information contained herein is derived from information provided by parties other than Homes.com. All information provided is deemed reliable, but is not guaranteed to be accurate and should be independently verified.
![]() The property listing data and information, or the Images, set forth herein were provided to MLS Property Information Network, Inc. from third party sources, including sellers, lessors and public records, and were compiled by MLS Property Information Network, Inc. The property listing data and information, and the Images, are for the personal, non-commercial use of consumers having a good faith interest in purchasing or leasing listed properties of the type displayed to them and may not be used for any purpose other than to identify prospective properties which such consumers may have a good faith interest in purchasing or leasing. MLS Property Information Network, Inc. and its subscribers disclaim any and all representations and warranties as to the accuracy of the property listing data and information, or as to the accuracy of any of the Images, set forth herein.
The property listing data and information, or the Images, set forth herein were provided to MLS Property Information Network, Inc. from third party sources, including sellers, lessors and public records, and were compiled by MLS Property Information Network, Inc. The property listing data and information, and the Images, are for the personal, non-commercial use of consumers having a good faith interest in purchasing or leasing listed properties of the type displayed to them and may not be used for any purpose other than to identify prospective properties which such consumers may have a good faith interest in purchasing or leasing. MLS Property Information Network, Inc. and its subscribers disclaim any and all representations and warranties as to the accuracy of the property listing data and information, or as to the accuracy of any of the Images, set forth herein.
Ask me questions while you tour the home.