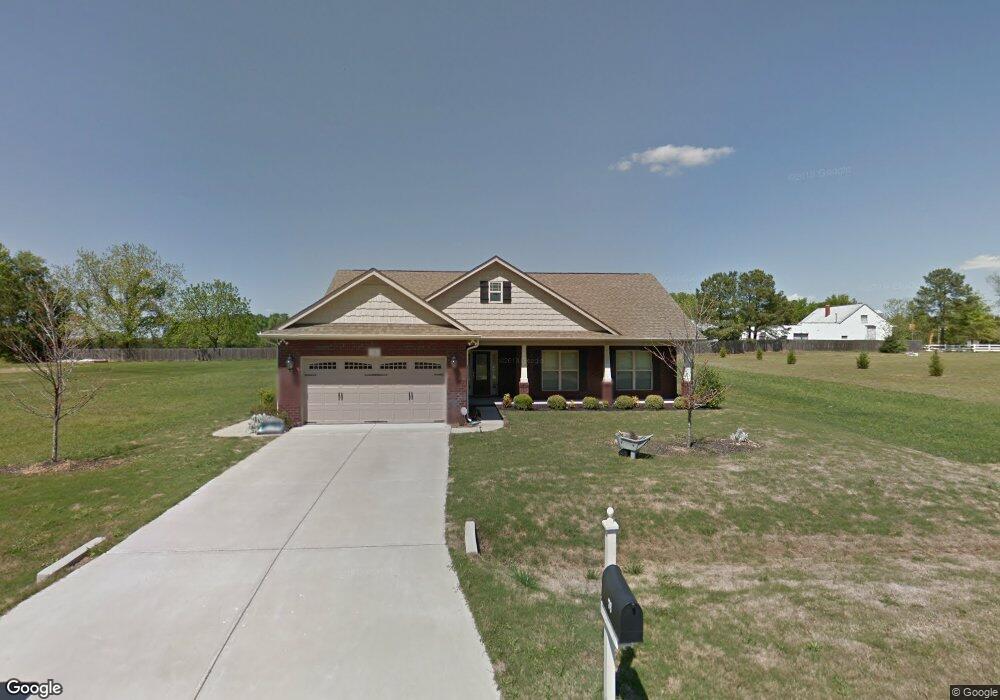
76 Fairhaven Dr Zebulon, NC 27597
O'Neals NeighborhoodEstimated Value: $332,578 - $377,000
4
Beds
2
Baths
1,750
Sq Ft
$204/Sq Ft
Est. Value
About This Home
This home is located at 76 Fairhaven Dr, Zebulon, NC 27597 and is currently estimated at $357,145, approximately $204 per square foot. 76 Fairhaven Dr is a home located in Johnston County with nearby schools including Corinth Holders Elementary School, Archer Lodge Middle School, and Corinth Holders High School.
Ownership History
Date
Name
Owned For
Owner Type
Purchase Details
Closed on
Jul 8, 2011
Sold by
Artis Junious A and Artis Carolyn D
Bought by
Frieson Vincent J and Harris Shannon
Current Estimated Value
Home Financials for this Owner
Home Financials are based on the most recent Mortgage that was taken out on this home.
Original Mortgage
$179,170
Outstanding Balance
$123,322
Interest Rate
4.52%
Mortgage Type
New Conventional
Estimated Equity
$233,823
Purchase Details
Closed on
Aug 23, 2009
Sold by
Adams Homes Aec Llc
Bought by
Artis Junious A and Artis Carolyn D
Home Financials for this Owner
Home Financials are based on the most recent Mortgage that was taken out on this home.
Original Mortgage
$115,000
Interest Rate
5.19%
Mortgage Type
New Conventional
Purchase Details
Closed on
May 21, 2008
Sold by
Loflin Nathan R and Loflin Starlyn M
Bought by
Adams Homes Aec Llc
Create a Home Valuation Report for This Property
The Home Valuation Report is an in-depth analysis detailing your home's value as well as a comparison with similar homes in the area
Home Values in the Area
Average Home Value in this Area
Purchase History
| Date | Buyer | Sale Price | Title Company |
|---|---|---|---|
| Frieson Vincent J | $173,000 | Market Title Ins Agency | |
| Artis Junious A | $195,000 | None Available | |
| Adams Homes Aec Llc | $195,000 | Morehead Title Company |
Source: Public Records
Mortgage History
| Date | Status | Borrower | Loan Amount |
|---|---|---|---|
| Open | Frieson Vincent J | $179,170 | |
| Previous Owner | Artis Junious A | $115,000 |
Source: Public Records
Tax History Compared to Growth
Tax History
| Year | Tax Paid | Tax Assessment Tax Assessment Total Assessment is a certain percentage of the fair market value that is determined by local assessors to be the total taxable value of land and additions on the property. | Land | Improvement |
|---|---|---|---|---|
| 2025 | $2,061 | $324,620 | $70,000 | $254,620 |
| 2024 | $1,578 | $194,790 | $38,000 | $156,790 |
| 2023 | $1,540 | $192,550 | $38,000 | $154,550 |
| 2022 | $1,617 | $192,550 | $38,000 | $154,550 |
| 2021 | $1,617 | $192,550 | $38,000 | $154,550 |
| 2020 | $1,656 | $192,550 | $38,000 | $154,550 |
| 2019 | $1,656 | $192,550 | $38,000 | $154,550 |
| 2018 | $1,489 | $169,220 | $28,000 | $141,220 |
| 2017 | $1,489 | $169,220 | $28,000 | $141,220 |
| 2016 | $1,489 | $169,220 | $28,000 | $141,220 |
| 2015 | $1,489 | $169,220 | $28,000 | $141,220 |
| 2014 | $1,489 | $169,220 | $28,000 | $141,220 |
Source: Public Records
Map
Nearby Homes
- 257 Fairhaven Dr
- 477 Creech Johnson Rd
- 940 Richardson Rd
- 620 Richardson Rd
- 46 Trusting Ln
- 274 Longbow Dr
- 107 Legolas Ct
- 327 Little Lady Trail
- 200 Longbow Dr
- 6595 N Carolina 231
- 88 Legolas Ct
- 200 Rock River Ln
- 100 Rock River Ln
- 116 Legolas Ct
- 106 Legolas Ct
- 68 Legolas Ct
- 6570 N Carolina 231
- 0 Highway 231 Unit Off
- 174 Arrow Ln
- 64 Doughty Ln Unit E
- 104 Fairhaven Dr
- 38 Fairhaven Dr
- 121 Fairhaven Dr
- 128 Fairhaven Dr
- 87 Fairhaven Dr
- 57 Fairhaven Dr
- 25 Fairhaven Dr
- 0 Fairhaven Dr Unit 1868945
- 0 Fairhaven Dr Unit 1868935
- 0 Fairhaven Dr Unit 1868946
- 0 Fairhaven Dr Unit 1868954
- 0 E Arbor Cove Ct Unit 1868947
- 0 Fairhaven Dr Unit 1881605
- 0 Fairhaven Dr Unit 1881599
- 0 E Arbor Cove Ct Unit 1881609
- 0 E Arbor Cove Ct Unit 1881611
- 0 Fairhaven Dr Unit lot2 TR1881599
- 0 Fairhaven Dr Unit 15 TR1881605
- 0 Fairhaven Dr Unit TR1881606
- 0 Fairhaven Dr Unit 16 1868954