76 High St Florence, MA 01062
Florence NeighborhoodEstimated Value: $798,000 - $847,000
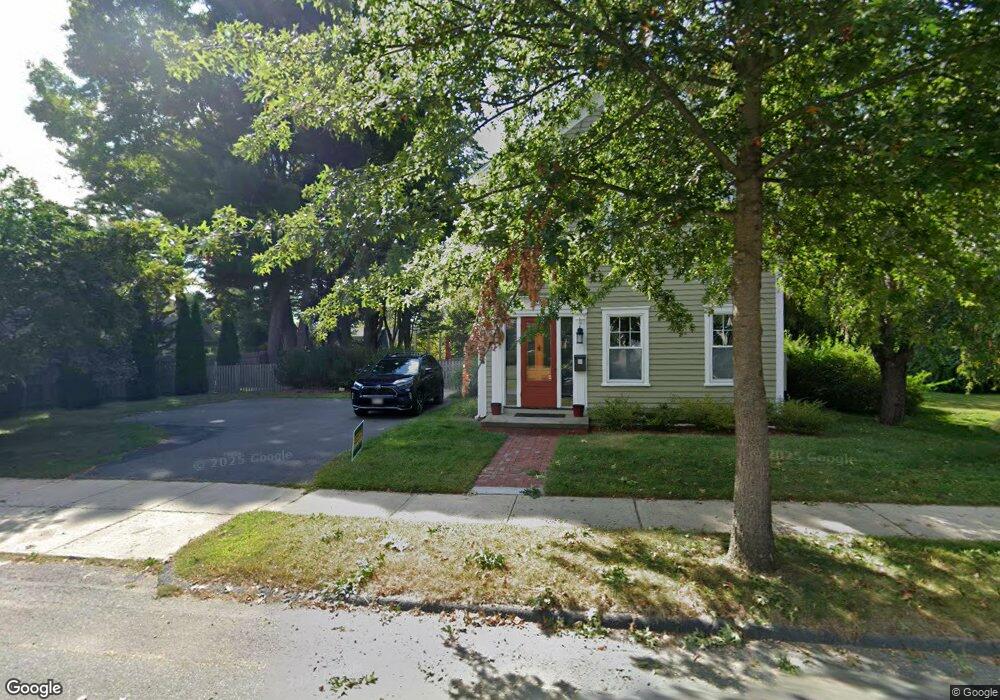
About This Home
This home is located at 76 High St, Florence, MA 01062 and is currently estimated at $823,151, approximately $302 per square foot. 76 High St is a home located in Hampshire County with nearby schools including Northampton High School, The Montessori School of Northampton, and Lander Grinspoon Academy.
Ownership History
We collect this data history from publicly available records. To have your information removed, we recommend requesting removal directly through your county’s website.
Purchase Details
Home Financials for this Owner
Home Financials are based on the most recent Mortgage that was taken out on this home.Home Values in the Area
Average Home Value in this Area
Purchase History
We collect this data history from publicly available records. To have your information removed, we recommend requesting removal directly through your county’s website.
| Date | Buyer | Sale Price | Title Company |
|---|---|---|---|
| $195,000 | -- |
Mortgage History
We collect this data history from publicly available records. To have your information removed, we recommend requesting removal directly through your county’s website.
| Date | Status | Borrower | Loan Amount |
|---|---|---|---|
| Open | $300,000 | ||
| Closed | $50,000 | ||
| Closed | $72,000 | ||
| Closed | $92,000 | ||
| Closed | $75,000 | ||
| Closed | $20,000 | ||
| Closed | $114,000 | ||
| Closed | $16,000 | ||
| Closed | $120,000 | ||
| Previous Owner | $29,000 | ||
| Previous Owner | $29,000 | ||
| Previous Owner | $50,000 |
Tax History
We collect this data history from publicly available records. To have your information removed, we recommend requesting removal directly through your county’s website.
| Year | Tax Paid | Tax Assessment Tax Assessment Total Assessment is a certain percentage of the fair market value that is determined by local assessors to be the total taxable value of land and additions on the property. | Land | Improvement |
|---|---|---|---|---|
| 2025 | $9,449 | $678,300 | $171,400 | $506,900 |
| 2024 | $9,035 | $594,800 | $149,700 | $445,100 |
| 2023 | $8,424 | $531,800 | $136,100 | $395,700 |
| 2022 | $7,424 | $415,000 | $127,300 | $287,700 |
| 2021 | $6,670 | $384,000 | $121,300 | $262,700 |
| 2020 | $6,451 | $384,000 | $121,300 | $262,700 |
| 2019 | $6,410 | $369,000 | $121,300 | $247,700 |
| 2018 | $6,286 | $368,900 | $121,300 | $247,600 |
| 2017 | $6,157 | $368,900 | $121,300 | $247,600 |
| 2016 | $5,961 | $368,900 | $121,300 | $247,600 |
| 2015 | $5,778 | $365,700 | $131,300 | $234,400 |
| 2014 | $5,628 | $365,700 | $131,300 | $234,400 |
Map
- 11 Plymouth Ave
- 14 Garfield St Unit A1
- 14 Garfield St Unit A2
- 14 Garfield St Unit B1
- 14 Garfield St Unit A3
- 41 N Main St
- 76 Maple St
- 114 S Main St
- 575 Bridge Rd Unit 13-4
- 33 Landy Ave
- 236 N Maple St
- 17 Florence Rd
- 208 N Elm St
- 56 Warner St
- 162 Prospect Ave Unit 6
- 162 Prospect Ave Unit 7
- 9 Khloe Ln
- 107 Riverside Dr
- 65 Blackberry Ln
- 67 Milton St
Ask me questions while you tour the home.