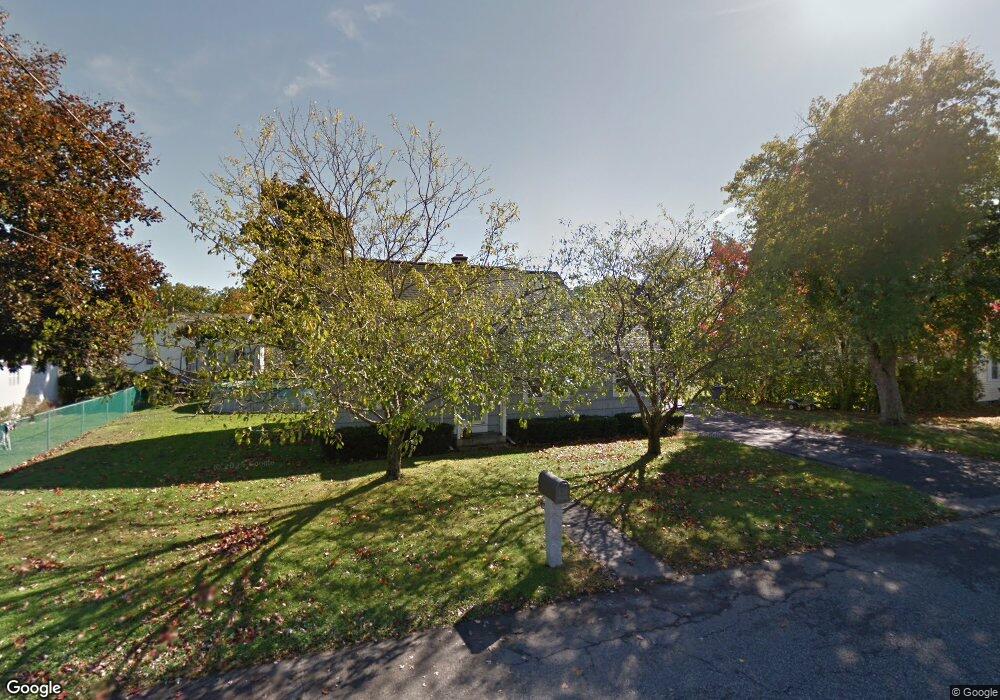
76 John St Ludlow, MA 01056
Estimated Value: $339,933 - $386,000
3
Beds
2
Baths
1,466
Sq Ft
$242/Sq Ft
Est. Value
About This Home
This home is located at 76 John St, Ludlow, MA 01056 and is currently estimated at $354,983, approximately $242 per square foot. 76 John St is a home located in Hampden County with nearby schools including East Street Elementary School, Chapin Street Elementary School, and Paul R. Baird Middle School.
Ownership History
Date
Name
Owned For
Owner Type
Purchase Details
Closed on
Sep 29, 2006
Sold by
Oxton Darryl E and Oxton Lisa A
Bought by
Skura Timothy J G
Current Estimated Value
Home Financials for this Owner
Home Financials are based on the most recent Mortgage that was taken out on this home.
Original Mortgage
$198,500
Outstanding Balance
$117,615
Interest Rate
6.52%
Mortgage Type
Purchase Money Mortgage
Estimated Equity
$237,368
Purchase Details
Closed on
Aug 31, 2001
Sold by
Suprenant Roger J and Suprenant Karen E
Bought by
Oxton Lisa A and Oxton Darryl E
Home Financials for this Owner
Home Financials are based on the most recent Mortgage that was taken out on this home.
Original Mortgage
$120,000
Interest Rate
7.06%
Mortgage Type
Purchase Money Mortgage
Create a Home Valuation Report for This Property
The Home Valuation Report is an in-depth analysis detailing your home's value as well as a comparison with similar homes in the area
Home Values in the Area
Average Home Value in this Area
Purchase History
| Date | Buyer | Sale Price | Title Company |
|---|---|---|---|
| Skura Timothy J G | $209,000 | -- | |
| Skura Timothy J G | $209,000 | -- | |
| Oxton Lisa A | $142,500 | -- | |
| Oxton Lisa A | $142,500 | -- |
Source: Public Records
Mortgage History
| Date | Status | Borrower | Loan Amount |
|---|---|---|---|
| Open | Skura Timothy J G | $198,500 | |
| Closed | Oxton Lisa A | $198,500 | |
| Previous Owner | Oxton Lisa A | $120,000 |
Source: Public Records
Tax History
| Year | Tax Paid | Tax Assessment Tax Assessment Total Assessment is a certain percentage of the fair market value that is determined by local assessors to be the total taxable value of land and additions on the property. | Land | Improvement |
|---|---|---|---|---|
| 2025 | $4,690 | $270,300 | $81,400 | $188,900 |
| 2024 | $4,557 | $251,900 | $81,400 | $170,500 |
| 2023 | $4,298 | $220,300 | $71,400 | $148,900 |
| 2022 | $4,116 | $205,900 | $71,400 | $134,500 |
| 2021 | $4,142 | $196,500 | $71,400 | $125,100 |
| 2020 | $3,969 | $192,500 | $70,300 | $122,200 |
| 2019 | $3,718 | $187,600 | $69,700 | $117,900 |
| 2018 | $3,494 | $183,800 | $69,700 | $114,100 |
| 2017 | $3,313 | $178,800 | $68,300 | $110,500 |
| 2016 | $3,147 | $173,600 | $66,900 | $106,700 |
| 2015 | $2,953 | $170,800 | $66,200 | $104,600 |
Source: Public Records
Map
Nearby Homes
- 84 Chapin Greene Dr
- 102 Swan Ave
- 42 Loopley St
- 26 Swan Ave
- 119 Blisswood Village Dr
- 70 Sroka Ln
- 665 Center St Unit 706
- '0' Rood St
- 70 Fuller St
- 0 Fuller St Unit 73409741
- 382 Holyoke St
- 47 Kendall St
- 57 Belmont St
- 50 Warsaw Ave
- Lot 602 Grandview Ave
- 31 Greenwich St
- 59 Prospect St
- 287 East St
- 482 Holyoke St
- 350 West St Unit 3
Your Personal Tour Guide
Ask me questions while you tour the home.