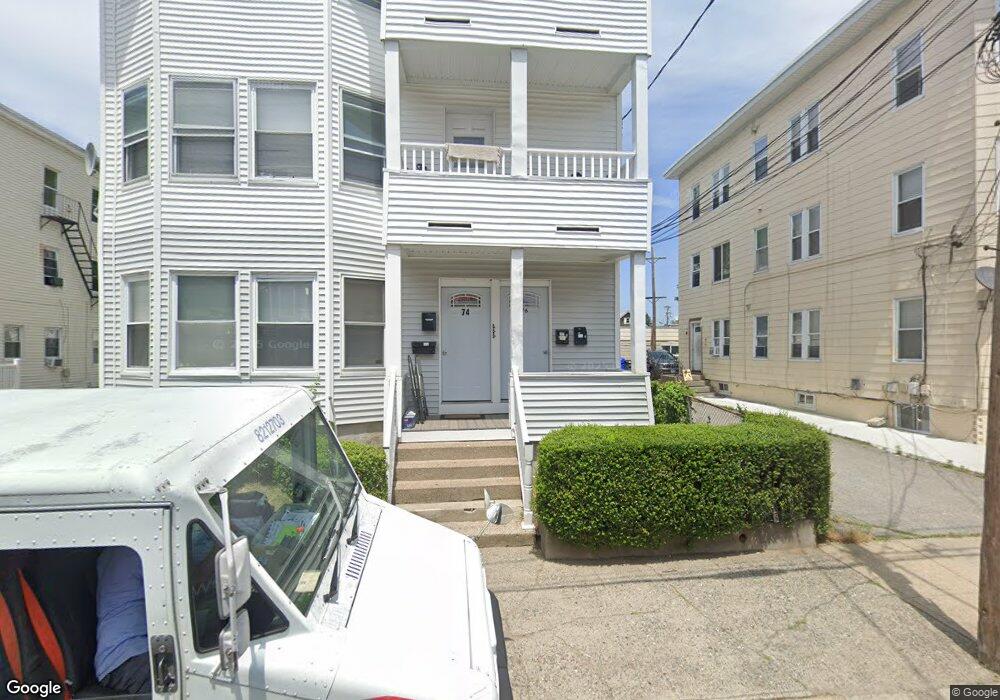
76 John St Pawtucket, RI 02861
Darlington NeighborhoodEstimated Value: $643,000 - $724,000
9
Beds
3
Baths
3,948
Sq Ft
$173/Sq Ft
Est. Value
About This Home
This home is located at 76 John St, Pawtucket, RI 02861 and is currently estimated at $683,500, approximately $173 per square foot. 76 John St is a home located in Providence County with nearby schools including St Cecilia School and Saint Raphael Academy.
Ownership History
Date
Name
Owned For
Owner Type
Purchase Details
Closed on
Sep 3, 2025
Sold by
Casimir Realty Llc
Bought by
Casimir Allen Realty Llc
Current Estimated Value
Home Financials for this Owner
Home Financials are based on the most recent Mortgage that was taken out on this home.
Original Mortgage
$351,000
Outstanding Balance
$350,380
Interest Rate
6.63%
Mortgage Type
New Conventional
Estimated Equity
$333,120
Purchase Details
Closed on
Mar 24, 2022
Sold by
Casimir Mones and Casimir Marie-Ange
Bought by
Casimir Realty Llc
Purchase Details
Closed on
Sep 28, 2010
Sold by
Markarian Markar
Bought by
Casimir Mones and Casimir Marie Ange
Home Financials for this Owner
Home Financials are based on the most recent Mortgage that was taken out on this home.
Original Mortgage
$97,500
Interest Rate
4.48%
Mortgage Type
Purchase Money Mortgage
Create a Home Valuation Report for This Property
The Home Valuation Report is an in-depth analysis detailing your home's value as well as a comparison with similar homes in the area
Home Values in the Area
Average Home Value in this Area
Purchase History
| Date | Buyer | Sale Price | Title Company |
|---|---|---|---|
| Casimir Allen Realty Llc | -- | -- | |
| Casimir Realty Llc | -- | None Available | |
| Casimir Realty Llc | -- | None Available | |
| Casimir Mones | $130,000 | -- | |
| Casimir Mones | $130,000 | -- |
Source: Public Records
Mortgage History
| Date | Status | Borrower | Loan Amount |
|---|---|---|---|
| Open | Casimir Allen Realty Llc | $351,000 | |
| Previous Owner | Casimir Mones | $141,500 | |
| Previous Owner | Casimir Mones | $136,500 | |
| Previous Owner | Casimir Mones | $97,500 |
Source: Public Records
Tax History
| Year | Tax Paid | Tax Assessment Tax Assessment Total Assessment is a certain percentage of the fair market value that is determined by local assessors to be the total taxable value of land and additions on the property. | Land | Improvement |
|---|---|---|---|---|
| 2025 | $6,767 | $514,600 | $115,500 | $399,100 |
| 2024 | $6,350 | $514,600 | $115,500 | $399,100 |
| 2023 | $6,683 | $394,500 | $88,900 | $305,600 |
| 2022 | $6,541 | $394,500 | $88,900 | $305,600 |
| 2021 | $6,541 | $394,500 | $88,900 | $305,600 |
| 2020 | $5,089 | $243,600 | $61,600 | $182,000 |
| 2019 | $5,089 | $243,600 | $61,600 | $182,000 |
| 2018 | $4,904 | $243,600 | $61,600 | $182,000 |
| 2017 | $4,748 | $209,000 | $47,800 | $161,200 |
| 2016 | $4,575 | $209,000 | $47,800 | $161,200 |
| 2015 | $4,575 | $209,000 | $47,800 | $161,200 |
| 2014 | $3,570 | $154,800 | $47,800 | $107,000 |
Source: Public Records
Map
Nearby Homes
- 39 John St
- 735 Broadway
- 39 Webster St Unit 204
- 215 Kenyon Ave
- 179 Columbine Ave
- 27 Collins Ave
- 386 Mendon Ave
- 79 Turner St
- 37 Turner St
- 40 Linton St
- 11 Appleton Ave
- 211 Carnation St
- 54 Sabin St
- 61 Mendon Rd
- 39 Chaplin St
- 25 Burke St
- 50 Pullman Ave Unit A
- 50 Pullman Ave Unit B
- 83 Chaplin St
- 91 Greenwich St
Your Personal Tour Guide
Ask me questions while you tour the home.