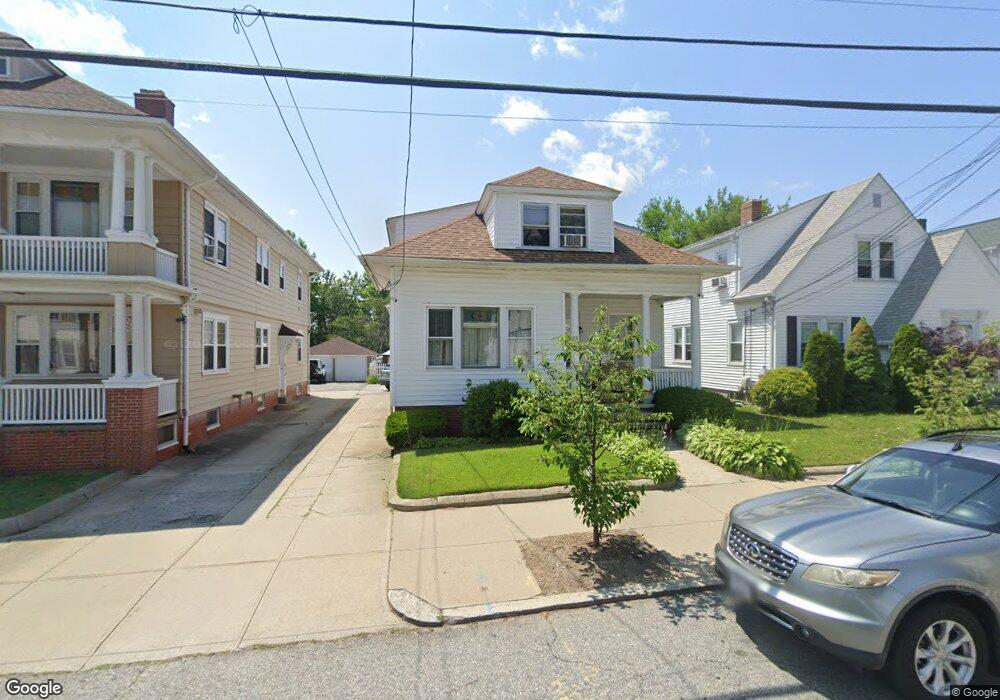
76 Langdon St Providence, RI 02904
Charles NeighborhoodEstimated Value: $424,780 - $530,000
5
Beds
2
Baths
2,203
Sq Ft
$221/Sq Ft
Est. Value
About This Home
This home is located at 76 Langdon St, Providence, RI 02904 and is currently estimated at $486,695, approximately $220 per square foot. 76 Langdon St is a home located in Providence County with nearby schools including Times Squared Academy, Times2 Elementary School, and Times2 Middle/High School.
Ownership History
Date
Name
Owned For
Owner Type
Purchase Details
Closed on
Jun 1, 2007
Sold by
Iovinelli Edward W
Bought by
Chanlatte Luz
Current Estimated Value
Home Financials for this Owner
Home Financials are based on the most recent Mortgage that was taken out on this home.
Original Mortgage
$272,000
Outstanding Balance
$166,080
Interest Rate
6.24%
Mortgage Type
Purchase Money Mortgage
Estimated Equity
$320,615
Create a Home Valuation Report for This Property
The Home Valuation Report is an in-depth analysis detailing your home's value as well as a comparison with similar homes in the area
Home Values in the Area
Average Home Value in this Area
Purchase History
| Date | Buyer | Sale Price | Title Company |
|---|---|---|---|
| Chanlatte Luz | $272,000 | -- |
Source: Public Records
Mortgage History
| Date | Status | Borrower | Loan Amount |
|---|---|---|---|
| Open | Chanlatte Luz | $272,000 |
Source: Public Records
Tax History
| Year | Tax Paid | Tax Assessment Tax Assessment Total Assessment is a certain percentage of the fair market value that is determined by local assessors to be the total taxable value of land and additions on the property. | Land | Improvement |
|---|---|---|---|---|
| 2025 | $3,260 | $431,800 | $126,700 | $305,100 |
| 2024 | $5,411 | $294,900 | $83,200 | $211,700 |
| 2023 | $5,411 | $294,900 | $83,200 | $211,700 |
| 2022 | $5,249 | $294,900 | $83,200 | $211,700 |
| 2021 | $4,661 | $189,800 | $60,300 | $129,500 |
| 2020 | $4,661 | $189,800 | $60,300 | $129,500 |
| 2019 | $4,661 | $189,800 | $60,300 | $129,500 |
| 2018 | $4,660 | $145,800 | $46,600 | $99,200 |
| 2017 | $4,660 | $145,800 | $46,600 | $99,200 |
| 2016 | $4,573 | $143,100 | $46,600 | $96,500 |
| 2015 | $4,247 | $128,300 | $47,200 | $81,100 |
| 2014 | $4,330 | $128,300 | $47,200 | $81,100 |
| 2013 | $4,330 | $128,300 | $47,200 | $81,100 |
Source: Public Records
Map
Nearby Homes
- 78 Langdon St
- 72 Langdon St
- 82 Langdon St
- 66 Langdon St
- 35 Lakeside St
- 69 Langdon St
- 69 Langdon St Unit 2nd Floor
- 69 Langdon St
- 69 Langdon St Unit First Floor
- 25 Lakeside St
- 62 Langdon St
- 75 Langdon St
- 79 Langdon St
- 87 Langdon St
- 60 Langdon St
- 90 Langdon St
- 145 Lakeside St
- 23 Lakeside St
- 63 Lakeside St
- 59 Lakeside St
Your Personal Tour Guide
Ask me questions while you tour the home.