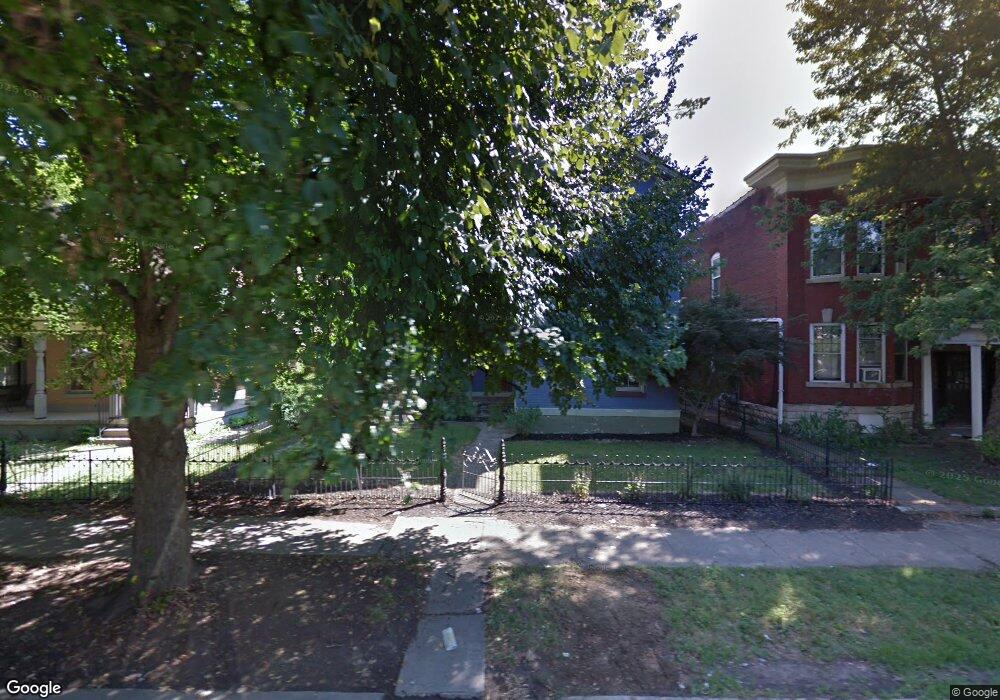
76 Linden Ave Dayton, OH 45403
Historic Inner East NeighborhoodEstimated Value: $134,064 - $290,000
2
Beds
3
Baths
1,828
Sq Ft
$114/Sq Ft
Est. Value
About This Home
This home is located at 76 Linden Ave, Dayton, OH 45403 and is currently estimated at $209,016, approximately $114 per square foot. 76 Linden Ave is a home located in Montgomery County with nearby schools including Ruskin Elementary School, Kiser Elementary, and Horizon Science Academy Dayton Downtown.
Ownership History
Date
Name
Owned For
Owner Type
Purchase Details
Closed on
May 6, 2022
Sold by
Bold Thomas
Bought by
Worsham Matthew
Current Estimated Value
Home Financials for this Owner
Home Financials are based on the most recent Mortgage that was taken out on this home.
Original Mortgage
$191,920
Outstanding Balance
$182,352
Interest Rate
5.27%
Mortgage Type
New Conventional
Estimated Equity
$26,664
Purchase Details
Closed on
Feb 19, 2021
Sold by
Miller Richard E
Bought by
Bold Thomas
Home Financials for this Owner
Home Financials are based on the most recent Mortgage that was taken out on this home.
Original Mortgage
$140,000
Interest Rate
2.7%
Mortgage Type
New Conventional
Purchase Details
Closed on
Sep 23, 2011
Sold by
Miller Greggory E and Miller Gregg
Bought by
Miller Richard E
Purchase Details
Closed on
Nov 13, 2003
Sold by
Murzyn Sandy L and Miller Roselyn A
Bought by
Miller Gregg and Miller Greg
Home Financials for this Owner
Home Financials are based on the most recent Mortgage that was taken out on this home.
Original Mortgage
$43,000
Interest Rate
8.35%
Mortgage Type
Purchase Money Mortgage
Create a Home Valuation Report for This Property
The Home Valuation Report is an in-depth analysis detailing your home's value as well as a comparison with similar homes in the area
Home Values in the Area
Average Home Value in this Area
Purchase History
| Date | Buyer | Sale Price | Title Company |
|---|---|---|---|
| Worsham Matthew | -- | None Listed On Document | |
| Bold Thomas | $175,000 | Home Services Title Llc | |
| Miller Richard E | -- | None Available | |
| Miller Gregg | $43,000 | -- |
Source: Public Records
Mortgage History
| Date | Status | Borrower | Loan Amount |
|---|---|---|---|
| Open | Worsham Matthew | $191,920 | |
| Previous Owner | Bold Thomas | $140,000 | |
| Previous Owner | Miller Gregg | $43,000 |
Source: Public Records
Tax History Compared to Growth
Tax History
| Year | Tax Paid | Tax Assessment Tax Assessment Total Assessment is a certain percentage of the fair market value that is determined by local assessors to be the total taxable value of land and additions on the property. | Land | Improvement |
|---|---|---|---|---|
| 2024 | $1,780 | $31,670 | $4,870 | $26,800 |
| 2023 | $1,780 | $31,670 | $4,870 | $26,800 |
| 2022 | $2,249 | $31,020 | $4,780 | $26,240 |
| 2021 | $2,237 | $31,020 | $4,780 | $26,240 |
| 2020 | $2,292 | $31,020 | $4,780 | $26,240 |
| 2019 | $1,895 | $23,010 | $4,780 | $18,230 |
| 2018 | $1,898 | $23,010 | $4,780 | $18,230 |
| 2017 | $1,884 | $23,010 | $4,780 | $18,230 |
| 2016 | $1,979 | $23,010 | $4,780 | $18,230 |
| 2015 | $1,302 | $23,010 | $4,780 | $18,230 |
| 2014 | $1,302 | $15,780 | $4,780 | $11,000 |
| 2012 | -- | $18,110 | $6,470 | $11,640 |
Source: Public Records
Map
Nearby Homes
- 60 Bell St
- 44 Bell St
- 44 Springfield St
- 2126 E 4th St
- 78 Huffman Ave Unit 76
- 35 Huffman Ave
- 2341 E 5th St
- 0 Huffman Ave
- 1820 E 4th St
- 1802 E 3rd St
- 57 S Torrence St
- 241 Linden Ave
- 150 Stainton Ave
- 21 Boltin St Unit 19
- 26 Boltin St Unit 26-28
- 28 Boltin St
- 62 Brenner Ave
- 41 Boltin St
- 1716 E 4th St
- 240 S Torrence St