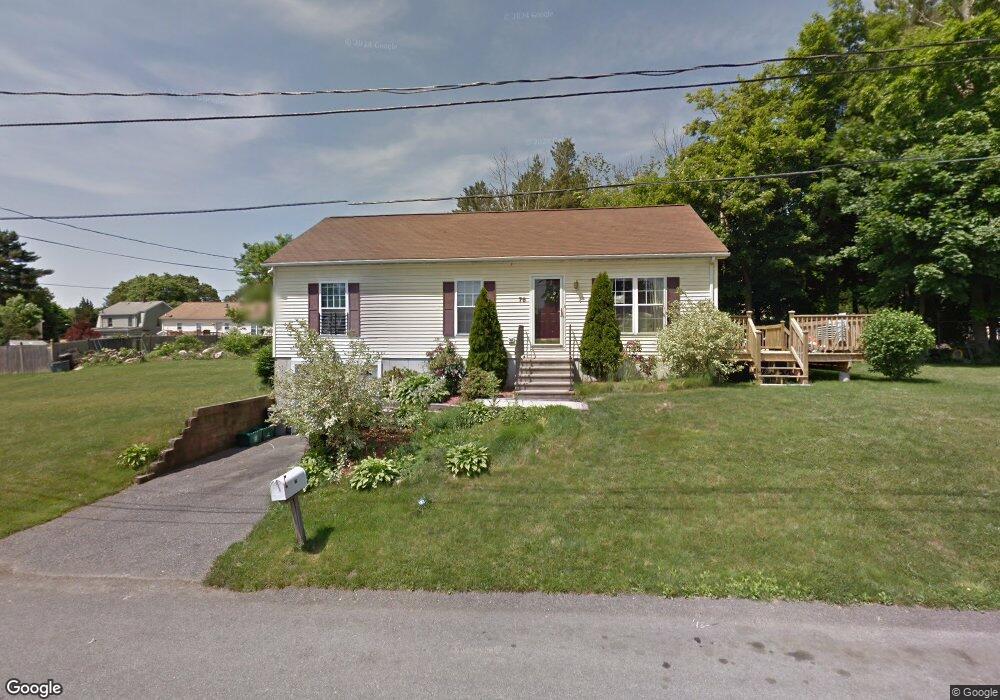
76 Russell Rd Brockton, MA 02302
Estimated Value: $494,655 - $513,000
3
Beds
2
Baths
1,144
Sq Ft
$442/Sq Ft
Est. Value
About This Home
This home is located at 76 Russell Rd, Brockton, MA 02302 and is currently estimated at $505,914, approximately $442 per square foot. 76 Russell Rd is a home located in Plymouth County with nearby schools including Brookfield Elementary School, Mary E. Baker Elementary School, and Downey Elementary School.
Ownership History
Date
Name
Owned For
Owner Type
Purchase Details
Closed on
Sep 29, 2004
Sold by
Clancy Paul E
Bought by
Lacome Isemene and Lacombe Ernst
Current Estimated Value
Purchase Details
Closed on
Aug 1, 2003
Sold by
Settlers Mildred E
Bought by
Clancy Paul E
Home Financials for this Owner
Home Financials are based on the most recent Mortgage that was taken out on this home.
Original Mortgage
$184,500
Interest Rate
5.28%
Mortgage Type
Purchase Money Mortgage
Purchase Details
Closed on
Mar 2, 2000
Sold by
Edgewood Farmes Rt 1
Bought by
Settlers Mildred E
Home Financials for this Owner
Home Financials are based on the most recent Mortgage that was taken out on this home.
Original Mortgage
$80,000
Interest Rate
8.21%
Mortgage Type
Purchase Money Mortgage
Create a Home Valuation Report for This Property
The Home Valuation Report is an in-depth analysis detailing your home's value as well as a comparison with similar homes in the area
Purchase History
| Date | Buyer | Sale Price | Title Company |
|---|---|---|---|
| Lacome Isemene | $266,000 | -- | |
| Clancy Paul E | $205,000 | -- | |
| Settlers Mildred E | $157,220 | -- |
Source: Public Records
Mortgage History
| Date | Status | Borrower | Loan Amount |
|---|---|---|---|
| Open | Settlers Mildred E | $255,600 | |
| Previous Owner | Settlers Mildred E | $184,500 | |
| Previous Owner | Settlers Mildred E | $80,000 |
Source: Public Records
Tax History
| Year | Tax Paid | Tax Assessment Tax Assessment Total Assessment is a certain percentage of the fair market value that is determined by local assessors to be the total taxable value of land and additions on the property. | Land | Improvement |
|---|---|---|---|---|
| 2025 | $5,801 | $479,000 | $144,000 | $335,000 |
| 2024 | $5,640 | $469,200 | $144,000 | $325,200 |
| 2023 | $5,188 | $399,700 | $108,700 | $291,000 |
| 2022 | $5,032 | $360,200 | $98,700 | $261,500 |
| 2021 | $4,649 | $320,600 | $91,300 | $229,300 |
| 2020 | $4,481 | $295,800 | $87,700 | $208,100 |
| 2019 | $4,214 | $271,200 | $81,100 | $190,100 |
| 2018 | $4,100 | $255,300 | $81,100 | $174,200 |
| 2017 | $3,862 | $239,900 | $81,100 | $158,800 |
| 2016 | $3,819 | $220,000 | $77,300 | $142,700 |
| 2015 | $3,488 | $192,200 | $77,300 | $114,900 |
| 2014 | $3,592 | $198,100 | $77,300 | $120,800 |
Source: Public Records
Map
Nearby Homes