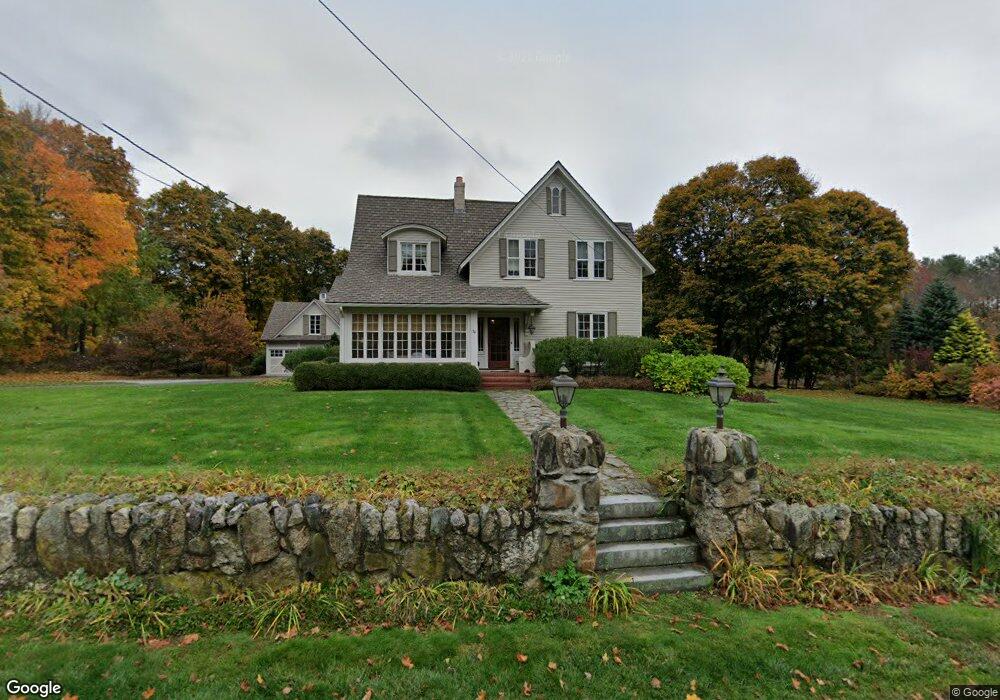
76 Salem St Andover, MA 01810
East Andover NeighborhoodEstimated Value: $1,559,000 - $1,917,000
4
Beds
4
Baths
3,455
Sq Ft
$503/Sq Ft
Est. Value
About This Home
This home is located at 76 Salem St, Andover, MA 01810 and is currently estimated at $1,736,973, approximately $502 per square foot. 76 Salem St is a home located in Essex County with nearby schools including Bancroft Elementary School, Doherty Middle School, and Andover High School.
Ownership History
Date
Name
Owned For
Owner Type
Purchase Details
Closed on
Oct 23, 2020
Sold by
Schwartz Steven L
Bought by
76 Salem St Nt
Current Estimated Value
Purchase Details
Closed on
Aug 17, 2020
Sold by
76 Salem St Nt
Bought by
Schwartz Steven L
Purchase Details
Closed on
Feb 19, 2016
Sold by
Schwartz Steven L
Bought by
76 Salem Street Nt
Purchase Details
Closed on
May 4, 2005
Sold by
Battaglia-Schwartz Lisa
Bought by
Battaglia-Schwartz Lisa
Purchase Details
Closed on
Dec 3, 2001
Sold by
Gbur Jonathan E
Bought by
Schwartz Steven L and Schwartz Lisa
Home Financials for this Owner
Home Financials are based on the most recent Mortgage that was taken out on this home.
Original Mortgage
$772,000
Interest Rate
6.66%
Mortgage Type
Purchase Money Mortgage
Purchase Details
Closed on
Apr 15, 1992
Sold by
Shupe Richard H
Bought by
Gbur Jonathan
Create a Home Valuation Report for This Property
The Home Valuation Report is an in-depth analysis detailing your home's value as well as a comparison with similar homes in the area
Home Values in the Area
Average Home Value in this Area
Purchase History
| Date | Buyer | Sale Price | Title Company |
|---|---|---|---|
| 76 Salem St Nt | -- | None Available | |
| Schwartz Steven L | -- | None Available | |
| 76 Salem Street Nt | -- | -- | |
| Battaglia-Schwartz Lisa | -- | -- | |
| Schwartz Steven L | $965,000 | -- | |
| Gbur Jonathan | $325,000 | -- |
Source: Public Records
Mortgage History
| Date | Status | Borrower | Loan Amount |
|---|---|---|---|
| Previous Owner | Gbur Jonathan | $685,000 | |
| Previous Owner | Gbur Jonathan | $772,000 |
Source: Public Records
Tax History
| Year | Tax Paid | Tax Assessment Tax Assessment Total Assessment is a certain percentage of the fair market value that is determined by local assessors to be the total taxable value of land and additions on the property. | Land | Improvement |
|---|---|---|---|---|
| 2024 | $17,889 | $1,388,900 | $621,000 | $767,900 |
| 2023 | $17,019 | $1,245,900 | $559,500 | $686,400 |
| 2022 | $16,355 | $1,120,200 | $495,500 | $624,700 |
| 2021 | $15,643 | $1,023,100 | $450,600 | $572,500 |
| 2020 | $15,002 | $999,500 | $439,700 | $559,800 |
| 2019 | $14,777 | $967,700 | $422,800 | $544,900 |
| 2018 | $14,056 | $898,700 | $398,800 | $499,900 |
| 2017 | $13,457 | $886,500 | $391,000 | $495,500 |
| 2016 | $13,138 | $886,500 | $391,000 | $495,500 |
| 2015 | $12,588 | $840,900 | $376,100 | $464,800 |
Source: Public Records
Map
Nearby Homes
Your Personal Tour Guide
Ask me questions while you tour the home.