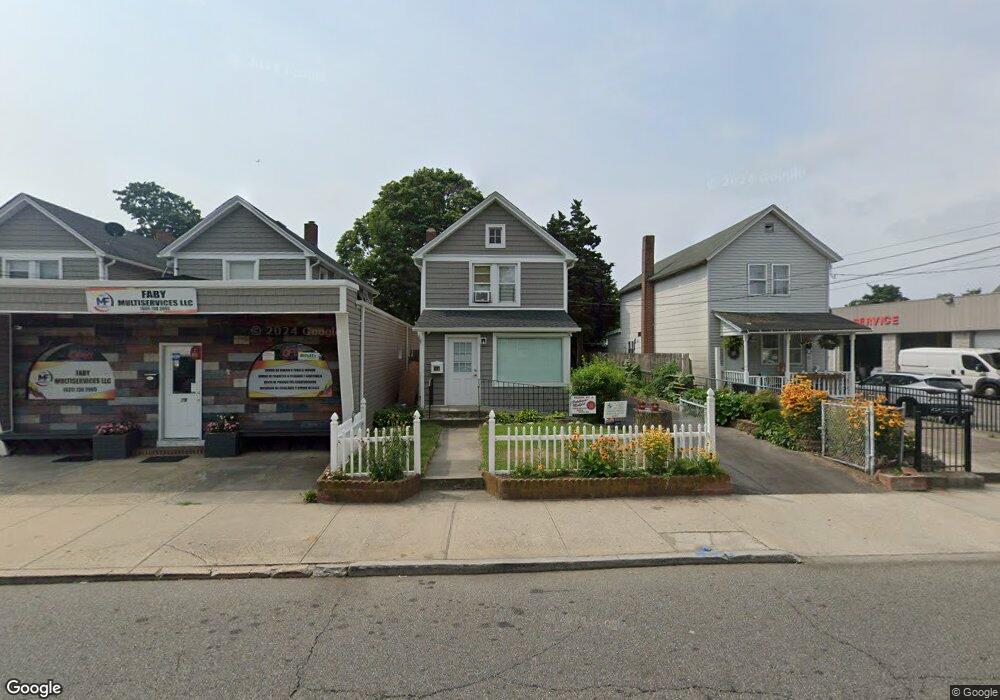
76 Terry St Patchogue, NY 11772
Estimated Value: $482,720
Studio
5
Baths
5,960
Sq Ft
$81/Sq Ft
Est. Value
About This Home
This home is located at 76 Terry St, Patchogue, NY 11772 and is currently estimated at $482,720, approximately $80 per square foot. 76 Terry St is a home located in Suffolk County with nearby schools including Patchogue-Medford High School and Holy Angels Regional School.
Ownership History
Date
Name
Owned For
Owner Type
Purchase Details
Closed on
Aug 23, 2022
Sold by
Yu Hanyu
Bought by
Joint Chiefs Ny Llc
Current Estimated Value
Purchase Details
Closed on
Dec 13, 2019
Sold by
Nengxin Group Usa Inc
Bought by
Yu Hanyu
Purchase Details
Closed on
Feb 2, 2010
Sold by
Deng Charles
Bought by
Nengxin Group Inc
Purchase Details
Closed on
Jan 12, 2005
Sold by
Ganetis Thomas A
Bought by
Deng Charles
Create a Home Valuation Report for This Property
The Home Valuation Report is an in-depth analysis detailing your home's value as well as a comparison with similar homes in the area
Home Values in the Area
Average Home Value in this Area
Purchase History
| Date | Buyer | Sale Price | Title Company |
|---|---|---|---|
| Joint Chiefs Ny Llc | $384,000 | First American Title | |
| Joint Chiefs Ny Llc | $384,000 | First American Title | |
| Yu Hanyu | $298,000 | None Available | |
| Yu Hanyu | $298,000 | None Available | |
| Nengxin Group Inc | $235,000 | -- | |
| Nengxin Group Inc | $235,000 | -- | |
| Deng Charles | $180,000 | Richard H Lee | |
| Deng Charles | $180,000 | Richard H Lee |
Source: Public Records
Tax History
| Year | Tax Paid | Tax Assessment Tax Assessment Total Assessment is a certain percentage of the fair market value that is determined by local assessors to be the total taxable value of land and additions on the property. | Land | Improvement |
|---|---|---|---|---|
| 2024 | $9,943 | $2,000 | $400 | $1,600 |
| 2023 | $7,997 | $2,000 | $400 | $1,600 |
| 2022 | $7,144 | $2,000 | $400 | $1,600 |
| 2021 | $7,144 | $2,000 | $400 | $1,600 |
| 2020 | $9,148 | $2,000 | $400 | $1,600 |
| 2019 | $9,119 | $0 | $0 | $0 |
| 2018 | $6,892 | $2,000 | $400 | $1,600 |
| 2017 | $6,892 | $2,000 | $400 | $1,600 |
| 2016 | $6,725 | $2,000 | $400 | $1,600 |
| 2015 | -- | $2,000 | $400 | $1,600 |
| 2014 | -- | $2,000 | $400 | $1,600 |
Source: Public Records
Map
Nearby Homes
Your Personal Tour Guide
Ask me questions while you tour the home.