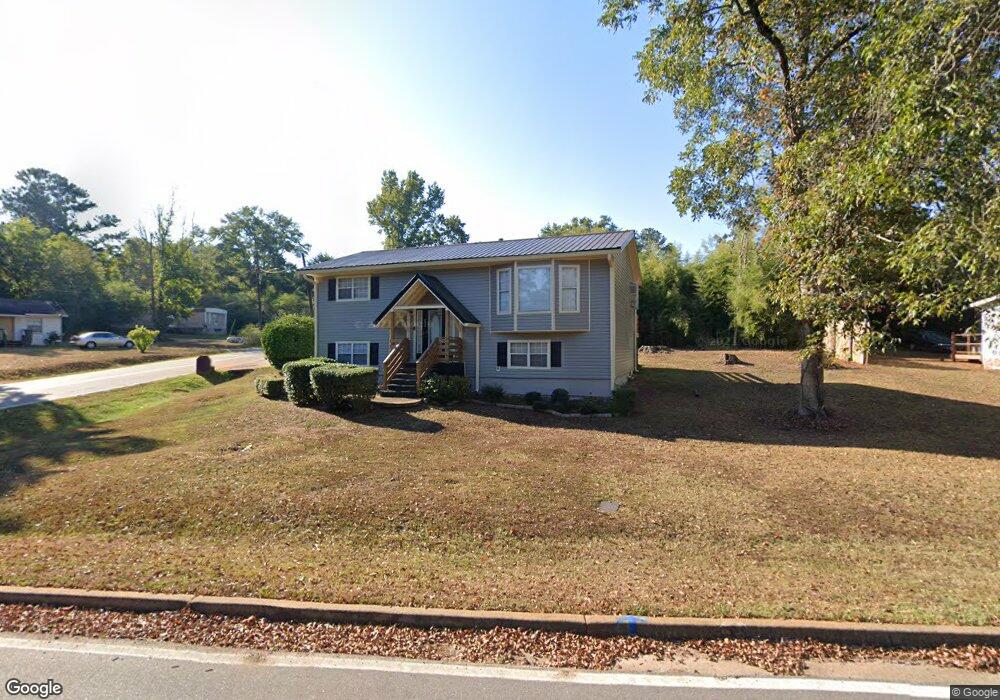
76 Thomas St Zebulon, GA 30295
Estimated Value: $197,015 - $227,000
--
Bed
10
Baths
960
Sq Ft
$223/Sq Ft
Est. Value
About This Home
This home is located at 76 Thomas St, Zebulon, GA 30295 and is currently estimated at $214,004, approximately $222 per square foot. 76 Thomas St is a home located in Pike County with nearby schools including Pike County Primary School, Pike County Elementary School, and Pike County Middle School.
Ownership History
Date
Name
Owned For
Owner Type
Purchase Details
Closed on
Sep 20, 2007
Sold by
Booker Harriet
Bought by
Harden Darjuan
Current Estimated Value
Home Financials for this Owner
Home Financials are based on the most recent Mortgage that was taken out on this home.
Original Mortgage
$94,751
Outstanding Balance
$59,743
Interest Rate
6.49%
Mortgage Type
New Conventional
Estimated Equity
$154,261
Purchase Details
Closed on
Jan 3, 2003
Sold by
Booker Michael and Booker Harriet
Bought by
Jones Shunda Barkley
Purchase Details
Closed on
May 23, 1998
Sold by
Mitchell Fannie Lizzie
Bought by
Burden Charles Monroe and Burden Betty
Purchase Details
Closed on
Dec 23, 1993
Sold by
Burden Charles Monroe and Burden Betty
Bought by
Booker Michael and Booker Harriet
Purchase Details
Closed on
Mar 12, 1992
Bought by
Burden Charles Monroe and Burden Betty
Purchase Details
Closed on
Jun 1, 1973
Bought by
Burden Charles Monroe and Burden Betty
Create a Home Valuation Report for This Property
The Home Valuation Report is an in-depth analysis detailing your home's value as well as a comparison with similar homes in the area
Home Values in the Area
Average Home Value in this Area
Purchase History
| Date | Buyer | Sale Price | Title Company |
|---|---|---|---|
| Harden Darjuan | $95,500 | -- | |
| Jones Shunda Barkley | $80,000 | -- | |
| Burden Charles Monroe | -- | -- | |
| Burden Charles Monroe | -- | -- | |
| Booker Michael | $52,000 | -- | |
| Burden Charles Monroe | -- | -- | |
| Burden Charles Monroe | -- | -- |
Source: Public Records
Mortgage History
| Date | Status | Borrower | Loan Amount |
|---|---|---|---|
| Open | Harden Darjuan | $94,751 |
Source: Public Records
Tax History Compared to Growth
Tax History
| Year | Tax Paid | Tax Assessment Tax Assessment Total Assessment is a certain percentage of the fair market value that is determined by local assessors to be the total taxable value of land and additions on the property. | Land | Improvement |
|---|---|---|---|---|
| 2024 | $2,150 | $67,907 | $8,000 | $59,907 |
| 2023 | $2,103 | $57,169 | $8,000 | $49,169 |
| 2022 | $1,375 | $37,897 | $4,000 | $33,897 |
| 2021 | $1,399 | $37,897 | $4,000 | $33,897 |
| 2020 | $1,434 | $37,897 | $4,000 | $33,897 |
| 2019 | $1,196 | $36,536 | $4,000 | $32,536 |
| 2018 | $1,197 | $36,536 | $4,000 | $32,536 |
| 2017 | $1,187 | $36,536 | $4,000 | $32,536 |
| 2016 | $1,102 | $36,536 | $4,000 | $32,536 |
| 2015 | $1,048 | $36,536 | $4,000 | $32,536 |
| 2014 | $1,063 | $36,536 | $4,000 | $32,536 |
| 2013 | -- | $36,536 | $4,000 | $32,536 |
Source: Public Records
Map
Nearby Homes
- 123 Griffin St
- 244 Wrightsburg Way
- 106 Wrightsburg Way
- 94 Wrightsburg Way
- 308 Wrightsburg Way
- 274 Caldwell Rd
- 203 Pine St
- 16156 Barnesville St
- 456 M l King jr Cir
- 0 US Highway 19 Unit 10432667
- 171 Jackson St
- 15316 Concord St
- 95 Joshua Ct
- 1004 Mill Race Unit 4
- 1019 Mill Race Unit 19
- 1003 Mill Race Unit 3
- 1002 Mill Race Unit 2
- 98 Whitfield Bend
- 637 Whitfield Walk
- 681 Whitfield Walk
- 34 Evans St
- 123 Evans St
- 102 Thomas St
- 461 Meansville St
- 71 Watson Dr
- 25 Thomas St
- 103 Thomas St
- 47 Martin Luther King jr Cir
- 37 Martin Luther King jr Cir
- 85 Ml King Junior Cir
- 85 Martin Luther King jr Cir
- 125 Thomas St
- 406 Meansville St
- 530 Meansville St
- 111 Martin Luther King jr Cir
- 58 Martin Luther King jr Cir
- 560 Meansville St
- 88 Martin Luther King jr Cir
- 36 Passmore St
- 127 Martin Luther King jr Cir