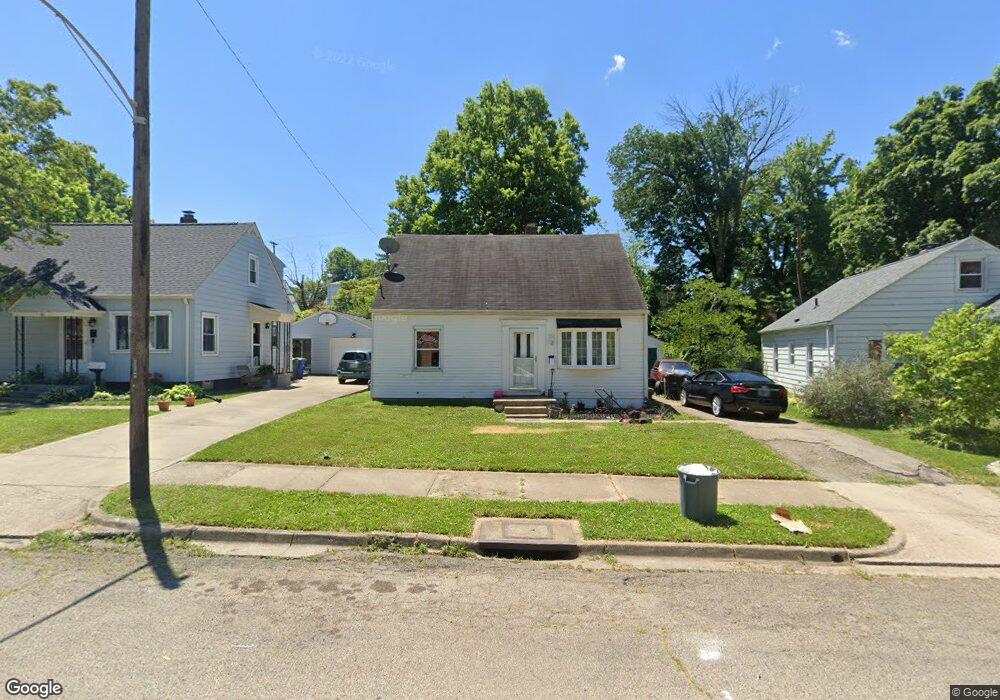
76 Thorpe Dr Dayton, OH 45420
Belmont NeighborhoodEstimated Value: $141,000 - $195,000
4
Beds
1
Bath
1,170
Sq Ft
$142/Sq Ft
Est. Value
About This Home
This home is located at 76 Thorpe Dr, Dayton, OH 45420 and is currently estimated at $165,672, approximately $141 per square foot. 76 Thorpe Dr is a home located in Montgomery County with nearby schools including Horace Mann Elementary School, Cleveland Elementary School, and Eastmont Elementary.
Ownership History
Date
Name
Owned For
Owner Type
Purchase Details
Closed on
Nov 6, 2013
Sold by
Fannie Mae
Bought by
Osborne Delbert W
Current Estimated Value
Purchase Details
Closed on
Jan 30, 2013
Sold by
Pytel Brandon K and Bank Of America Na
Bought by
Fannie Mae and Federal National Mortgage Association
Purchase Details
Closed on
Aug 24, 2006
Sold by
Landed Gentry Investments Llc
Bought by
Pytel Brandon K and Pytel Marie C
Home Financials for this Owner
Home Financials are based on the most recent Mortgage that was taken out on this home.
Original Mortgage
$88,000
Interest Rate
6.77%
Mortgage Type
Purchase Money Mortgage
Purchase Details
Closed on
Nov 9, 2004
Sold by
Gillman Charles A
Bought by
Landed Gentry Investments Llc
Purchase Details
Closed on
May 20, 1998
Sold by
Palmer Michael J
Bought by
Gillman Charles Andrew and Gillman Vicki Lynn
Home Financials for this Owner
Home Financials are based on the most recent Mortgage that was taken out on this home.
Original Mortgage
$62,300
Interest Rate
7.5%
Purchase Details
Closed on
Mar 31, 1995
Sold by
Palmer Tamara R
Bought by
Palmer Michael J
Create a Home Valuation Report for This Property
The Home Valuation Report is an in-depth analysis detailing your home's value as well as a comparison with similar homes in the area
Home Values in the Area
Average Home Value in this Area
Purchase History
| Date | Buyer | Sale Price | Title Company |
|---|---|---|---|
| Osborne Delbert W | -- | None Available | |
| Fannie Mae | $34,000 | None Available | |
| Pytel Brandon K | $88,000 | None Available | |
| Landed Gentry Investments Llc | $73,000 | None Available | |
| Gillman Charles Andrew | $77,900 | -- | |
| Gillman Charles Andrew | $77,900 | -- | |
| Palmer Michael J | -- | -- |
Source: Public Records
Mortgage History
| Date | Status | Borrower | Loan Amount |
|---|---|---|---|
| Previous Owner | Pytel Brandon K | $88,000 | |
| Previous Owner | Gillman Charles Andrew | $62,300 |
Source: Public Records
Tax History Compared to Growth
Tax History
| Year | Tax Paid | Tax Assessment Tax Assessment Total Assessment is a certain percentage of the fair market value that is determined by local assessors to be the total taxable value of land and additions on the property. | Land | Improvement |
|---|---|---|---|---|
| 2024 | $2,481 | $44,280 | $7,600 | $36,680 |
| 2023 | $2,481 | $44,280 | $7,600 | $36,680 |
| 2022 | $2,225 | $30,690 | $5,280 | $25,410 |
| 2021 | $2,213 | $30,690 | $5,280 | $25,410 |
| 2020 | $2,373 | $30,690 | $5,280 | $25,410 |
| 2019 | $1,546 | $19,230 | $5,860 | $13,370 |
| 2018 | $1,548 | $19,230 | $5,860 | $13,370 |
| 2017 | $1,536 | $19,230 | $5,860 | $13,370 |
| 2016 | $1,629 | $19,230 | $5,860 | $13,370 |
| 2015 | $1,542 | $19,230 | $5,860 | $13,370 |
| 2014 | $1,542 | $19,230 | $5,860 | $13,370 |
| 2012 | -- | $32,230 | $6,580 | $25,650 |
Source: Public Records
Map
Nearby Homes
- 816 Wilmington Ave
- 709 Wilmington Ave
- 312 Shroyer Rd
- 150 Nordale Ave
- 1136 Irving Ave
- 507 Wilmington Ave
- 1029 Wilmington Ave
- 525 Kling Dr
- 557 Shroyer Rd
- 2900 Lansing Dr
- 551 Kling Dr
- 3125 Cottage Terrace
- 456 Roy Ave
- 434 Bellaire Ave
- 724 Patterson Rd
- 2225 King Ave
- 2229 Nill Ave
- 726 Acorn Dr
- 2242 Nill Ave
- 2600 Wayne Ave
- 82 Thorpe Dr
- 88 Thorpe Dr
- 19 Nordale Ave
- 68 Thorpe Dr
- 13 Nordale Ave
- 25 Nordale Ave
- 31 Nordale Ave
- 67 Thorpe Dr
- 62 Thorpe Dr
- 81 Thorpe Dr
- 740 Wilmington Ave
- 715 Allenwood Ct
- 744 Wilmington Ave
- 736 Wilmington Ave
- 56 Thorpe Dr
- 732 Wilmington Ave
- 613 Allenwood Ct
- 804 Wilmington Ave
- 728 Wilmington Ave
- 49 Thorpe Dr