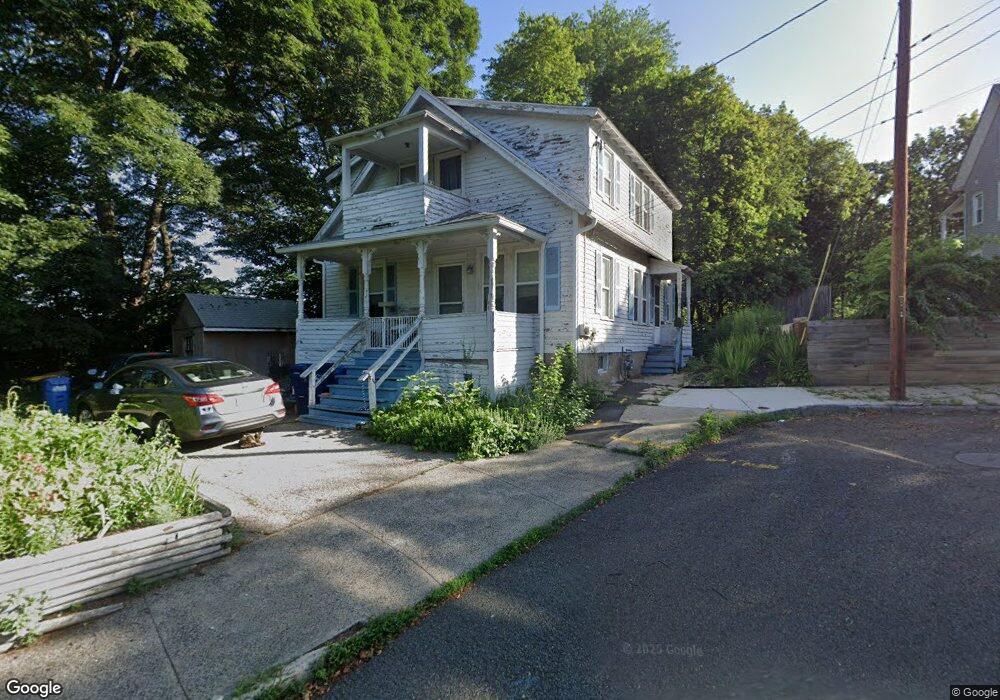
76 Vine St Ansonia, CT 06401
Estimated Value: $348,721 - $387,000
4
Beds
2
Baths
1,519
Sq Ft
$242/Sq Ft
Est. Value
About This Home
This home is located at 76 Vine St, Ansonia, CT 06401 and is currently estimated at $367,680, approximately $242 per square foot. 76 Vine St is a home located in New Haven County with nearby schools including Ansonia Middle School, Ansonia High School, and St Mary & St Michael School.
Ownership History
Date
Name
Owned For
Owner Type
Purchase Details
Closed on
Apr 8, 2003
Sold by
Tappan Scott T and Tappan Bonnie
Bought by
Graham Kevin and Graham Linda A
Current Estimated Value
Home Financials for this Owner
Home Financials are based on the most recent Mortgage that was taken out on this home.
Original Mortgage
$136,800
Interest Rate
5.88%
Purchase Details
Closed on
May 30, 1995
Sold by
Donofrio Alton R and Donofrio Gailyn V
Bought by
Tappan Scott T and Tappan Bonnie J
Home Financials for this Owner
Home Financials are based on the most recent Mortgage that was taken out on this home.
Original Mortgage
$87,500
Interest Rate
5.5%
Mortgage Type
Unknown
Create a Home Valuation Report for This Property
The Home Valuation Report is an in-depth analysis detailing your home's value as well as a comparison with similar homes in the area
Home Values in the Area
Average Home Value in this Area
Purchase History
| Date | Buyer | Sale Price | Title Company |
|---|---|---|---|
| Graham Kevin | $144,000 | -- | |
| Tappan Scott T | $98,000 | -- |
Source: Public Records
Mortgage History
| Date | Status | Borrower | Loan Amount |
|---|---|---|---|
| Open | Tappan Scott T | $132,000 | |
| Closed | Tappan Scott T | $136,800 | |
| Previous Owner | Tappan Scott T | $21,500 | |
| Previous Owner | Tappan Scott T | $87,500 |
Source: Public Records
Tax History
| Year | Tax Paid | Tax Assessment Tax Assessment Total Assessment is a certain percentage of the fair market value that is determined by local assessors to be the total taxable value of land and additions on the property. | Land | Improvement |
|---|---|---|---|---|
| 2025 | $4,708 | $164,920 | $37,380 | $127,540 |
| 2024 | $4,369 | $164,920 | $37,380 | $127,540 |
| 2023 | $4,328 | $164,920 | $37,380 | $127,540 |
| 2022 | $3,697 | $97,800 | $33,000 | $64,800 |
| 2021 | $3,697 | $97,800 | $33,000 | $64,800 |
| 2020 | $63,596 | $97,800 | $33,000 | $64,800 |
| 2019 | $3,697 | $97,800 | $33,000 | $64,800 |
| 2018 | $60,798 | $97,800 | $33,000 | $64,800 |
| 2017 | $57,535 | $104,800 | $37,900 | $66,900 |
| 2016 | $3,911 | $104,800 | $37,900 | $66,900 |
| 2015 | $3,932 | $104,800 | $37,900 | $66,900 |
| 2014 | $4,046 | $104,800 | $37,900 | $66,900 |
| 2013 | $4,123 | $104,800 | $37,900 | $66,900 |
Source: Public Records
Map
Nearby Homes
Your Personal Tour Guide
Ask me questions while you tour the home.