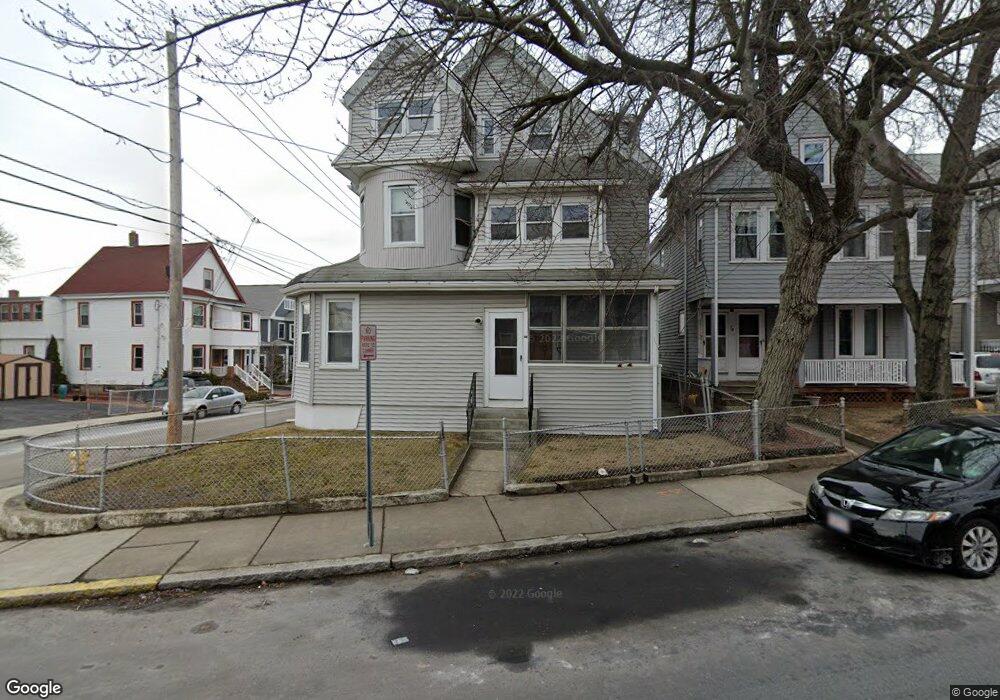
76 Winchester St Unit 1 Medford, MA 02155
South Medford NeighborhoodEstimated Value: $1,102,000 - $1,129,000
2
Beds
1
Bath
900
Sq Ft
$1,237/Sq Ft
Est. Value
About This Home
This home is located at 76 Winchester St Unit 1, Medford, MA 02155 and is currently estimated at $1,113,000, approximately $1,236 per square foot. 76 Winchester St Unit 1 is a home located in Middlesex County with nearby schools including Medford High School and St. Clement Elementary School.
Ownership History
Date
Name
Owned For
Owner Type
Purchase Details
Closed on
Feb 4, 2015
Sold by
76 Winchester Street R
Bought by
Smr South Medford Real
Current Estimated Value
Purchase Details
Closed on
Aug 2, 2004
Sold by
Silvestro George C and Silvestro Mary L
Bought by
76 Winchester Street R and Silvestro Ft Llc
Create a Home Valuation Report for This Property
The Home Valuation Report is an in-depth analysis detailing your home's value as well as a comparison with similar homes in the area
Home Values in the Area
Average Home Value in this Area
Purchase History
| Date | Buyer | Sale Price | Title Company |
|---|---|---|---|
| Smr South Medford Real | -- | -- | |
| 76 Winchester Street R | -- | -- |
Source: Public Records
Tax History Compared to Growth
Tax History
| Year | Tax Paid | Tax Assessment Tax Assessment Total Assessment is a certain percentage of the fair market value that is determined by local assessors to be the total taxable value of land and additions on the property. | Land | Improvement |
|---|---|---|---|---|
| 2025 | $7,473 | $877,100 | $312,200 | $564,900 |
| 2024 | $7,473 | $877,100 | $312,200 | $564,900 |
| 2023 | $7,328 | $847,200 | $291,700 | $555,500 |
| 2022 | $7,395 | $820,700 | $265,200 | $555,500 |
| 2021 | $7,221 | $767,400 | $252,600 | $514,800 |
| 2020 | $6,920 | $753,800 | $252,600 | $501,200 |
| 2019 | $6,793 | $707,600 | $229,600 | $478,000 |
| 2018 | $6,634 | $647,900 | $208,700 | $439,200 |
| 2017 | $6,166 | $583,900 | $195,100 | $388,800 |
| 2016 | $5,859 | $523,600 | $177,400 | $346,200 |
| 2015 | $5,618 | $480,200 | $168,900 | $311,300 |
Source: Public Records
Map
Nearby Homes
- 595 Broadway Unit 202
- 595 Broadway Unit 302
- 595 Broadway Unit 101
- 11 Albion St
- 501 Main St
- 69 Boston Ave
- 31 Wareham St
- 74 Josephine Ave Unit B
- 87 Medford St Unit 504
- 87 Medford St Unit 305
- 60 Pearson Ave Unit 60
- 54 Lowden Ave Unit 2
- 519 Broadway Unit 302
- 39 Rogers Ave
- 25 Warner St
- 11 Bonner Ave Unit 2
- 11 Bonner Ave Unit 1
- 26 Warner St
- 34 Fiske Ave Unit B
- 34 Fiske Ave Unit A
- 76 Winchester St
- 78 Winchester St
- 78 Winchester St Unit 2
- 78 Winchester St Unit 78 2
- 78 Winchester St Unit 78 1
- 80 Winchester St Unit 1
- 80 Winchester St
- 66 Morton Ave
- 66 Morton Ave Unit 1
- 66 Morton Ave
- 66 Morton Ave Unit 2
- 77 Winchester St
- 77 Winchester St Unit 1
- 73 Newbern Ave
- 73 Newbern Ave Unit 1
- 63 Newbern Ave
- 67 Morton Ave
- 73 Winchester St
- 75 Winchester St Unit 1
- 73 Winchester St