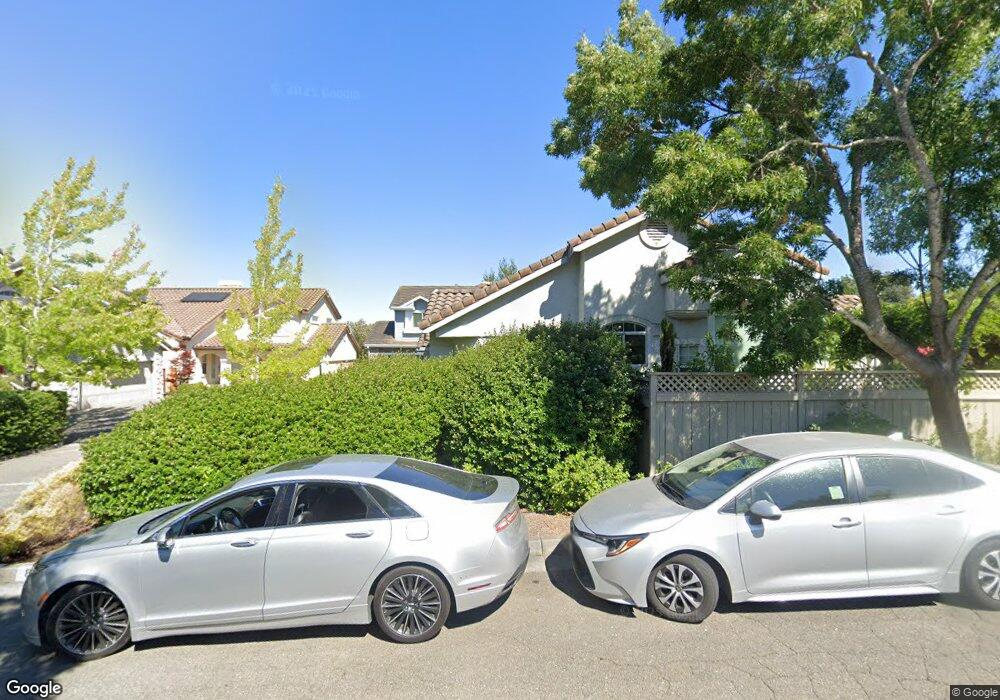
76 Windsor Ln Petaluma, CA 94952
Western Petaluma NeighborhoodEstimated Value: $1,167,000 - $1,265,000
4
Beds
3
Baths
2,484
Sq Ft
$496/Sq Ft
Est. Value
About This Home
This home is located at 76 Windsor Ln, Petaluma, CA 94952 and is currently estimated at $1,231,136, approximately $495 per square foot. 76 Windsor Ln is a home located in Sonoma County with nearby schools including McNear Elementary School, Petaluma Junior High School, and Petaluma High School.
Ownership History
Date
Name
Owned For
Owner Type
Purchase Details
Closed on
Mar 4, 2021
Sold by
Feldstein Jason H and Feldstein Nancy C
Bought by
Feldstein Jason H and Feldstein Nancy C
Current Estimated Value
Home Financials for this Owner
Home Financials are based on the most recent Mortgage that was taken out on this home.
Original Mortgage
$502,628
Outstanding Balance
$450,570
Interest Rate
2.7%
Mortgage Type
New Conventional
Estimated Equity
$780,566
Purchase Details
Closed on
Mar 28, 2017
Sold by
Feldstein Jason H and Feldstein Nancy C
Bought by
Feldstein Jason H and Feldstein Nancy C
Purchase Details
Closed on
Feb 29, 2016
Sold by
Nugent Thomas Edward and Lucero Nugent Viola Rae
Bought by
Feldstein Jason and Feldstein Nancy
Home Financials for this Owner
Home Financials are based on the most recent Mortgage that was taken out on this home.
Original Mortgage
$554,300
Interest Rate
3.81%
Mortgage Type
New Conventional
Purchase Details
Closed on
Aug 17, 2010
Sold by
Curran Michael and Curran Carol
Bought by
Nugent Thomas Edward and Lucero Nugent Viola Rae
Purchase Details
Closed on
Jan 28, 2010
Sold by
Curran Michael
Bought by
Curran Michael and Curran Carol
Home Financials for this Owner
Home Financials are based on the most recent Mortgage that was taken out on this home.
Original Mortgage
$412,500
Interest Rate
5.03%
Mortgage Type
New Conventional
Purchase Details
Closed on
Oct 27, 2006
Sold by
Chuck Allan
Bought by
Curran Michael
Home Financials for this Owner
Home Financials are based on the most recent Mortgage that was taken out on this home.
Original Mortgage
$484,000
Interest Rate
5.75%
Mortgage Type
Purchase Money Mortgage
Purchase Details
Closed on
Oct 25, 2006
Sold by
Curran Carol C
Bought by
Curran Michael
Home Financials for this Owner
Home Financials are based on the most recent Mortgage that was taken out on this home.
Original Mortgage
$484,000
Interest Rate
5.75%
Mortgage Type
Purchase Money Mortgage
Create a Home Valuation Report for This Property
The Home Valuation Report is an in-depth analysis detailing your home's value as well as a comparison with similar homes in the area
Home Values in the Area
Average Home Value in this Area
Purchase History
| Date | Buyer | Sale Price | Title Company |
|---|---|---|---|
| Feldstein Jason H | -- | Accommodation | |
| Feldstein Jason H | -- | Radian Settlement Svcs Inc | |
| Feldstein Jason H | -- | None Available | |
| Feldstein Jason | $750,000 | Fidelity National Title Co | |
| Nugent Thomas Edward | $520,000 | Fidelity National Title Co | |
| Curran Michael | -- | First American Title Company | |
| Curran Michael | $605,000 | Financial Title Company | |
| Curran Michael | -- | Financial Title Company |
Source: Public Records
Mortgage History
| Date | Status | Borrower | Loan Amount |
|---|---|---|---|
| Open | Feldstein Jason H | $502,628 | |
| Closed | Feldstein Jason | $554,300 | |
| Previous Owner | Curran Michael | $412,500 | |
| Previous Owner | Curran Michael | $484,000 |
Source: Public Records
Tax History
| Year | Tax Paid | Tax Assessment Tax Assessment Total Assessment is a certain percentage of the fair market value that is determined by local assessors to be the total taxable value of land and additions on the property. | Land | Improvement |
|---|---|---|---|---|
| 2025 | $9,485 | $887,841 | $355,136 | $532,705 |
| 2024 | $9,485 | $870,433 | $348,173 | $522,260 |
| 2023 | $9,485 | $853,367 | $341,347 | $512,020 |
| 2022 | $9,204 | $836,635 | $334,654 | $501,981 |
| 2021 | $9,029 | $820,232 | $328,093 | $492,139 |
| 2020 | $9,107 | $811,822 | $324,729 | $487,093 |
| 2019 | $8,993 | $795,905 | $318,362 | $477,543 |
| 2018 | $8,957 | $780,300 | $312,120 | $468,180 |
| 2017 | $8,767 | $765,000 | $306,000 | $459,000 |
| 2016 | $6,519 | $562,773 | $238,096 | $324,677 |
| 2015 | $6,429 | $554,321 | $234,520 | $319,801 |
| 2014 | $6,398 | $543,464 | $229,927 | $313,537 |
Source: Public Records
Map
Nearby Homes
Your Personal Tour Guide
Ask me questions while you tour the home.