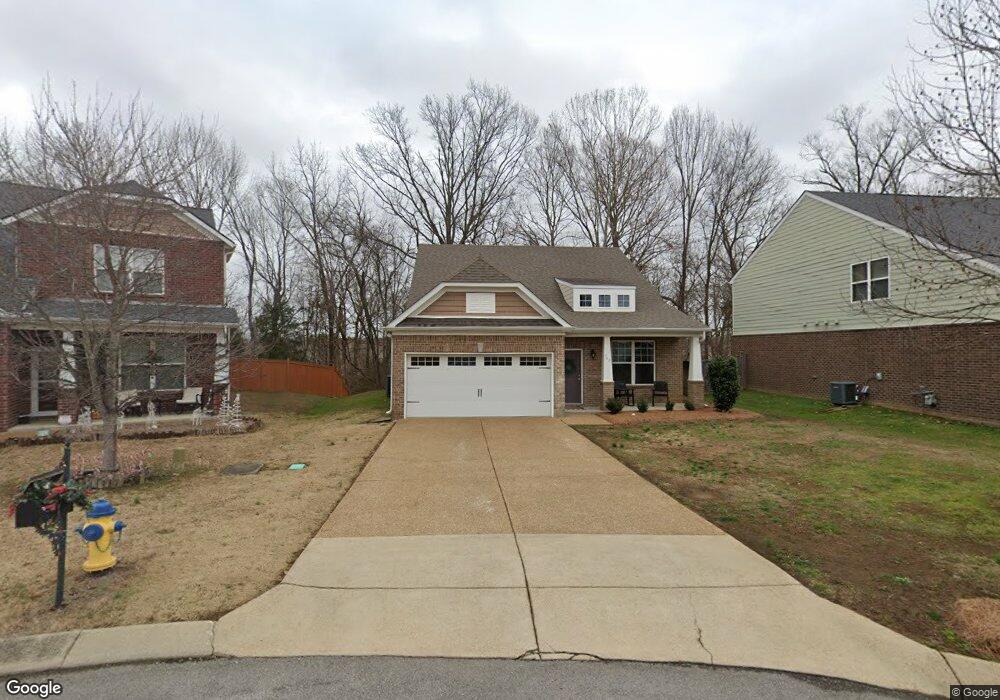
760 Bench Ln Unit 760 Mount Juliet, TN 37122
Estimated Value: $503,568 - $537,000
--
Bed
3
Baths
2,404
Sq Ft
$215/Sq Ft
Est. Value
About This Home
This home is located at 760 Bench Ln Unit 760, Mount Juliet, TN 37122 and is currently estimated at $516,642, approximately $214 per square foot. 760 Bench Ln Unit 760 is a home located in Wilson County with nearby schools including Rutland Elementary School, Gladeville Middle School, and Wilson Central High School.
Ownership History
Date
Name
Owned For
Owner Type
Purchase Details
Closed on
Aug 25, 2025
Sold by
Glaskox William
Bought by
William Kenneth Glaskox And Teresa Martin Gla
Current Estimated Value
Purchase Details
Closed on
Apr 30, 2015
Sold by
Grandinetti Michael C
Bought by
Glaskox William
Home Financials for this Owner
Home Financials are based on the most recent Mortgage that was taken out on this home.
Original Mortgage
$172,425
Interest Rate
3.8%
Mortgage Type
New Conventional
Purchase Details
Closed on
Sep 27, 2013
Sold by
Beazer Homes Corp
Bought by
Grandinetti Michael C and Grandinetti Luanne G
Home Financials for this Owner
Home Financials are based on the most recent Mortgage that was taken out on this home.
Original Mortgage
$222,832
Interest Rate
4.53%
Mortgage Type
Commercial
Purchase Details
Closed on
May 4, 2010
Bought by
Green Trails Llc
Create a Home Valuation Report for This Property
The Home Valuation Report is an in-depth analysis detailing your home's value as well as a comparison with similar homes in the area
Home Values in the Area
Average Home Value in this Area
Purchase History
| Date | Buyer | Sale Price | Title Company |
|---|---|---|---|
| William Kenneth Glaskox And Teresa Martin Gla | -- | None Listed On Document | |
| Glaskox William | $229,900 | -- | |
| Grandinetti Michael C | $229,900 | -- | |
| Green Trails Llc | $450,000 | -- |
Source: Public Records
Mortgage History
| Date | Status | Borrower | Loan Amount |
|---|---|---|---|
| Previous Owner | Glaskox William | $172,425 | |
| Previous Owner | Grandinetti Michael C | $222,832 |
Source: Public Records
Tax History Compared to Growth
Tax History
| Year | Tax Paid | Tax Assessment Tax Assessment Total Assessment is a certain percentage of the fair market value that is determined by local assessors to be the total taxable value of land and additions on the property. | Land | Improvement |
|---|---|---|---|---|
| 2024 | $1,562 | $81,825 | $21,250 | $60,575 |
| 2022 | $1,562 | $81,825 | $21,250 | $60,575 |
| 2021 | $1,652 | $81,825 | $21,250 | $60,575 |
| 2020 | $1,679 | $81,825 | $21,250 | $60,575 |
| 2019 | $208 | $62,275 | $14,375 | $47,900 |
| 2018 | $1,673 | $62,275 | $14,375 | $47,900 |
| 2017 | $1,673 | $62,275 | $14,375 | $47,900 |
| 2016 | $1,673 | $62,275 | $14,375 | $47,900 |
| 2015 | $1,725 | $62,275 | $14,375 | $47,900 |
| 2014 | -- | $49,904 | $0 | $0 |
Source: Public Records
Map
Nearby Homes
- 1209 Cannon Ln
- 1154 Bastion Cir
- 1144 Bastion Cir
- 625 Foster Ln
- 3107 S Dunnwood Ln
- 227 S Dunnwood Ln
- 215 S Dunnwood Ln
- 134 Dahlgren Dr
- 120 Southern Way Blvd
- 500 Pine Valley Rd
- Weston Plan at Waterford Park
- Ashford Plan at Waterford Park
- Harper Plan at Waterford Park
- Landon Plan at Waterford Park
- Ellington Plan at Waterford Park
- 650 Foster Ln
- 602 Brigadier St
- 807 Cawthorn Ln
- 3307 Maple Brook Ln
- 302 Blockade Ln