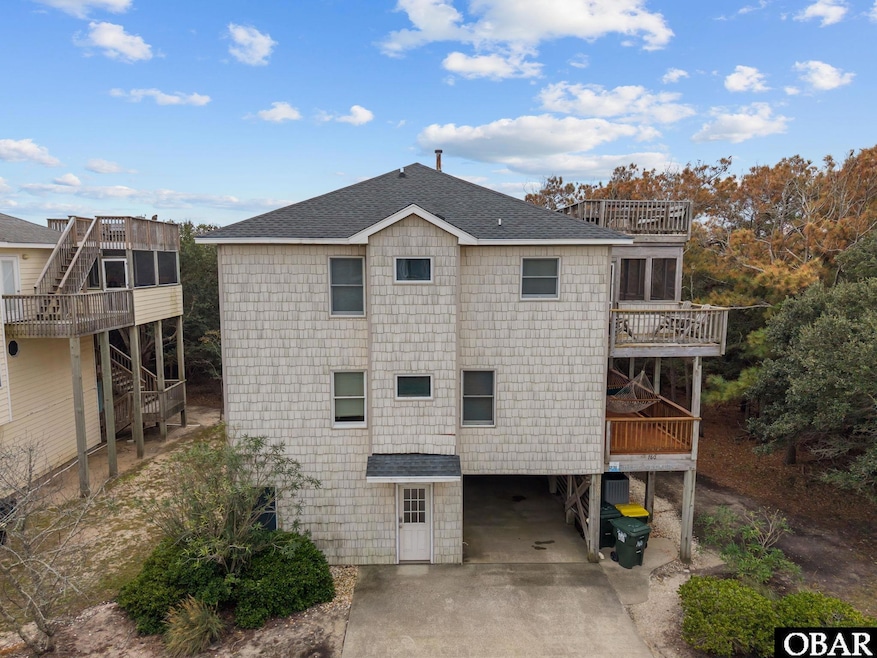
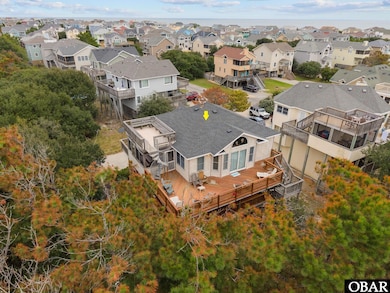
760 Crown Point Cir Unit Lot 40 Corolla, NC 27927
Estimated payment $3,677/month
Highlights
- Community Beach Access
- Pond View
- Cathedral Ceiling
- Outdoor Pool
- Contemporary Architecture
- Tennis Courts
About This Home
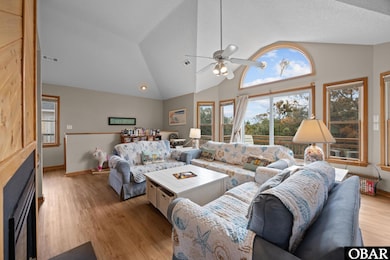
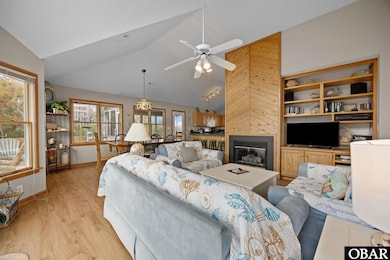
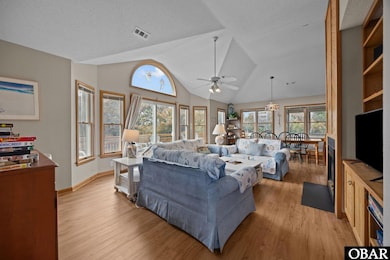
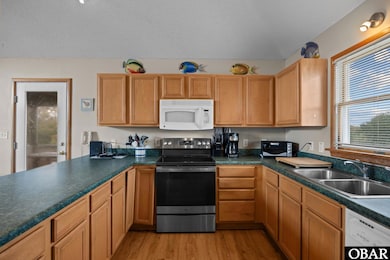
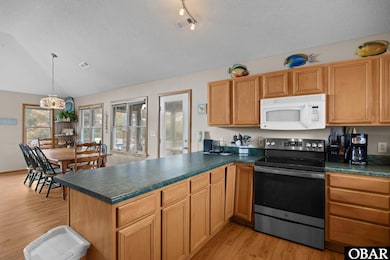
Price Reduction!! Wonderful opportunity in this Corolla Oceanside community of Crown Point! This reverse floor plan home offers an open top level with a large kitchen with granite counters, nice living and dining areas with vaulted ceilings and multiple accesses to the top floor deck and screened porch. LVT flooring throughout the top level offers a smooth flow and hosts an ensuite bedroom in addition to a half bathroom. The mid level includes another full ensuite bedroom with private deck access, 2 more large bedrooms with a connected full bathroom, and the laundry area. The ground floor offers a large sitting area and game room, another half bathroom and storage closets. New stove replaced in 2022, new top level HVAC unit replaced in 2023. The very top level deck offers an astounding 360 degree panoramic view of Corolla. An easy walk to the community beach access, and the beautiful community swimming pool and tennis court! Crown Point is conveniently located to the wonderful shops and restaurants of TimBuck II Village! The house has polybutylene pipes with no known leaking issues. The house has a Saturday Turnover, however is vacant for the better part of the winter. Sellers have never used the gas fireplace, they do not have a propane tank and do not warrant nor guarantee the workmanship of the gas fireplace. Brand new Hot Water Heater installed fall of 2025!
Listing Agent
Southern Shores Realty Brokerage Phone: 252-261-2000 License #225898 Listed on: 09/15/2025
Home Details
Home Type
- Single Family
Est. Annual Taxes
- $4,892
Year Built
- Built in 1995
Lot Details
- 7,298 Sq Ft Lot
- Property fronts a private road
- Level Lot
- Property is zoned SFO
Parking
- Off-Street Parking
Home Design
- Contemporary Architecture
- Reverse Style Home
- Slab Foundation
- Frame Construction
- Vinyl Siding
- Piling Construction
Interior Spaces
- 2,348 Sq Ft Home
- Cathedral Ceiling
- Fireplace
- Pond Views
Kitchen
- Oven or Range
- Microwave
- Ice Maker
- Dishwasher
Flooring
- Carpet
- Ceramic Tile
- Vinyl
Bedrooms and Bathrooms
- 4 Bedrooms
Laundry
- Dryer
- Washer
Pool
- Outdoor Pool
Utilities
- Zoned Heating
- Heat Pump System
- Municipal Utilities District Water
Community Details
Overview
- Association fees include pool, road maintenance, tennis courts
- Crown Point Subdivision
Recreation
- Community Beach Access
- Tennis Courts
- Community Pool
Building Details
Map
Home Values in the Area
Average Home Value in this Area
Tax History
| Year | Tax Paid | Tax Assessment Tax Assessment Total Assessment is a certain percentage of the fair market value that is determined by local assessors to be the total taxable value of land and additions on the property. | Land | Improvement |
|---|---|---|---|---|
| 2024 | $4,892 | $397,700 | $110,000 | $287,700 |
| 2023 | $4,876 | $397,700 | $110,000 | $287,700 |
| 2022 | $3,509 | $397,700 | $110,000 | $287,700 |
| 2021 | $3,091 | $405,100 | $160,000 | $245,100 |
| 2020 | $3,100 | $405,100 | $160,000 | $245,100 |
| 2019 | $3,097 | $405,100 | $160,000 | $245,100 |
| 2018 | $3,138 | $405,100 | $160,000 | $245,100 |
| 2017 | $2,916 | $405,100 | $160,000 | $245,100 |
| 2016 | $2,626 | $405,100 | $160,000 | $245,100 |
| 2015 | $2,462 | $405,100 | $160,000 | $245,100 |
Property History
| Date | Event | Price | List to Sale | Price per Sq Ft |
|---|---|---|---|---|
| 11/05/2025 11/05/25 | Price Changed | $619,000 | -1.6% | $264 / Sq Ft |
| 10/04/2025 10/04/25 | Price Changed | $629,000 | -1.6% | $268 / Sq Ft |
| 09/15/2025 09/15/25 | For Sale | $639,000 | -- | $272 / Sq Ft |
Purchase History
| Date | Type | Sale Price | Title Company |
|---|---|---|---|
| Deed | $406,000 | None Available | |
| Warranty Deed | $362,000 | None Available |
Mortgage History
| Date | Status | Loan Amount | Loan Type |
|---|---|---|---|
| Open | $365,400 | New Conventional | |
| Previous Owner | $289,600 | New Conventional |
Source: Outer Banks Association of REALTORS®
MLS Number: 130501
APN: 116A-000-0040-0000
Disclaimer: Certain information contained herein is derived from information provided by parties other than Homes.com. All information provided is deemed reliable, but is not guaranteed to be accurate and should be independently verified.
![]() IDX information is provided exclusively for personal, non-commercial use, and may not be used for any purpose other than to identify prospective properties consumers may be interested in purchasing.
IDX information is provided exclusively for personal, non-commercial use, and may not be used for any purpose other than to identify prospective properties consumers may be interested in purchasing.
Information is deemed reliable but not guaranteed.
- 783 Crown Point Cir Unit Lot 9
- 759 Sand Dollar Ct Unit 176
- 758 Voyager Rd Unit lot 64
- 721 Crown Point Cir
- 775 Bayberry Ct Unit Lot 94
- 773 Voyager Rd Unit lot 77
- 767 Gulfstream Ct Unit Lot 3
- 767 Gulfstream Ct
- 834 Hunt Club Dr
- 834 Hunt Club Dr Unit Lot 389
- 792 Broad St Unit Lot 18
- 822 Whistler Ct Unit 383
- 655 Pampas Ct Unit Lot 162
- 800 Corolla Dr Unit 61
- 818 Whistler Ct Unit 381
- 646 Tide Arch Unit Lot 112
- 776 Hunt Club Dr Unit Lot 323
- 754 Cormorant Trail Unit Lot 79
- 771 Cormorant Trail Unit Lot 49
- 811 Corolla Dr Unit Lot 55
- 996 Cruz Bay Ln Unit ID1048803P
- 1010 Cruz Bay Ln Unit ID1048830P
- 113 Briggs St
- 100 Sea Colony Dr Unit ID1049601P
- 205 S End Rd
- 315 Orchard Dr
- 2036 Portsmouth St
- 2027 Hampton St Unit ID1060716P
- 1870 Weeksville Rd
- 1221 Carolina Ave Unit 3d
- 414 Harbor Bay Dr
- 1510 Crescent Dr
- 1100 W Williams Cir
- 105 Farmridge Way
- 100 Fost Blvd
- 103 Sandra Rd
- 501 N Road St Unit B
- 200 S Elliott St
- 1347 US 17 S
- 106 Quail Run Unit Cozy Cottage
