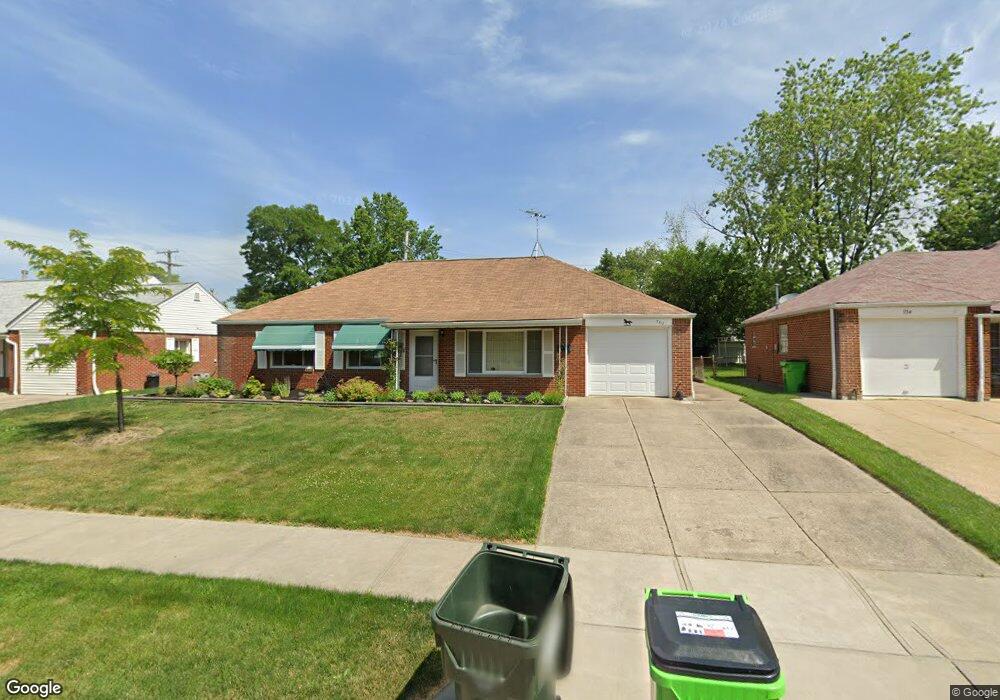
760 Hemlock Dr Euclid, OH 44132
Estimated Value: $176,000 - $203,000
3
Beds
2
Baths
1,733
Sq Ft
$108/Sq Ft
Est. Value
About This Home
This home is located at 760 Hemlock Dr, Euclid, OH 44132 and is currently estimated at $187,431, approximately $108 per square foot. 760 Hemlock Dr is a home located in Cuyahoga County with nearby schools including Shoreview Elementary School, Euclid High School, and Mater Dei Academy.
Ownership History
Date
Name
Owned For
Owner Type
Purchase Details
Closed on
May 2, 1996
Sold by
Karpy Ronald E
Bought by
Jerkich Gregory P
Current Estimated Value
Home Financials for this Owner
Home Financials are based on the most recent Mortgage that was taken out on this home.
Original Mortgage
$62,900
Outstanding Balance
$902
Interest Rate
7.86%
Mortgage Type
New Conventional
Estimated Equity
$186,529
Purchase Details
Closed on
Mar 29, 1991
Sold by
Rosipko James G
Bought by
Karpy Ronald E
Purchase Details
Closed on
Nov 16, 1990
Sold by
Rosipko Florence M
Bought by
Rosipko Florence M
Purchase Details
Closed on
Nov 10, 1986
Sold by
Rosipko George A
Bought by
Rosipko Florence M
Purchase Details
Closed on
Apr 2, 1985
Sold by
Rosipko George A
Bought by
Rosipko George A
Purchase Details
Closed on
Jun 20, 1983
Sold by
Morrison William O
Bought by
Rosipko George A
Purchase Details
Closed on
Sep 28, 1978
Sold by
Cradis Wm
Bought by
Morrison William O
Purchase Details
Closed on
Jan 1, 1975
Bought by
Cradis Wm
Create a Home Valuation Report for This Property
The Home Valuation Report is an in-depth analysis detailing your home's value as well as a comparison with similar homes in the area
Home Values in the Area
Average Home Value in this Area
Purchase History
We collect this data history from publicly available records. To have your information removed, we recommend requesting removal directly through your county’s website.
| Date | Buyer | Sale Price | Title Company |
|---|---|---|---|
| Jerkich Gregory P | $89,900 | -- | |
| Karpy Ronald E | $71,000 | -- | |
| Rosipko Florence M | -- | -- | |
| Rosipko Florence M | -- | -- | |
| Rosipko George A | -- | -- | |
| Rosipko George A | $68,000 | -- | |
| Morrison William O | $62,500 | -- | |
| Cradis Wm | -- | -- |
Source: Public Records
Mortgage History
We collect this data history from publicly available records. To have your information removed, we recommend requesting removal directly through your county’s website.
| Date | Status | Borrower | Loan Amount |
|---|---|---|---|
| Open | Jerkich Gregory P | $62,900 |
Source: Public Records
Tax History
| Year | Tax Paid | Tax Assessment Tax Assessment Total Assessment is a certain percentage of the fair market value that is determined by local assessors to be the total taxable value of land and additions on the property. | Land | Improvement |
|---|---|---|---|---|
| 2025 | $3,185 | $58,905 | $9,695 | $49,210 |
| 2024 | $3,312 | $58,905 | $9,695 | $49,210 |
| 2023 | $2,833 | $42,600 | $8,540 | $34,060 |
| 2022 | $2,800 | $42,600 | $8,540 | $34,060 |
| 2021 | $3,118 | $42,600 | $8,540 | $34,060 |
| 2020 | $2,402 | $32,270 | $6,480 | $25,800 |
| 2019 | $2,176 | $92,200 | $18,500 | $73,700 |
| 2018 | $2,146 | $32,270 | $6,480 | $25,800 |
| 2017 | $2,271 | $28,600 | $5,220 | $23,380 |
| 2016 | $2,276 | $28,600 | $5,220 | $23,380 |
| 2015 | $2,074 | $28,600 | $5,220 | $23,380 |
| 2014 | $2,074 | $28,600 | $5,220 | $23,380 |
Source: Public Records
Map
Nearby Homes
- 754 Hemlock Dr
- 670 Walnut Dr
- 26831 Shoreview Ave
- 26361 Elinore Ave
- 610 E 266th St
- 27182 Oriole Ave
- 26530 Shoreview Ave
- 29023 Weber Ave
- 29107 Fuller Ave
- 420 E 271st St
- 25671 Farringdon Ave
- 25650 Richards Ave
- 25600 Zeman Ave
- 434 E 272nd St
- 25370 Drakefield Ave
- 25401 Farringdon Ave
- 29234 Grand Blvd
- 355 E 257th St
- 805 E 254th St
- 406 E 274th St
- 754 Hemlock Dr Unit ID1061094P
- 766 Hemlock Dr
- 721 Willow Dr
- 750 Hemlock Dr
- 715 Willow Dr
- 727 Willow Dr
- 759 Hemlock Dr
- 755 Hemlock Dr
- 27191 Gary Ave
- 767 Hemlock Dr
- 746 Hemlock Dr
- 709 Willow Dr
- 753 Hemlock Dr
- 27190 Drakefield Ave
- 27171 Gary Ave
- 27190 Gary Ave
- 747 Hemlock Dr
- 742 Hemlock Dr
- 27170 Drakefield Ave
- 707 Willow Dr
Your Personal Tour Guide
Ask me questions while you tour the home.