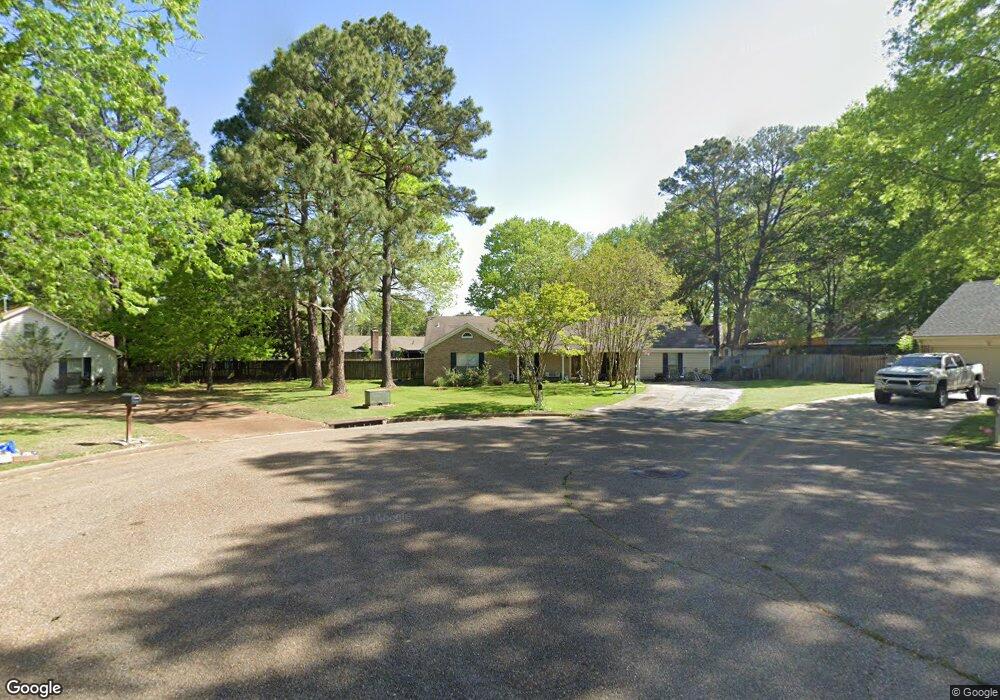
760 Joe Wood Cove Collierville, TN 38017
Estimated Value: $320,000 - $372,000
3
Beds
2
Baths
1,918
Sq Ft
$179/Sq Ft
Est. Value
About This Home
This home is located at 760 Joe Wood Cove, Collierville, TN 38017 and is currently estimated at $343,429, approximately $179 per square foot. 760 Joe Wood Cove is a home located in Shelby County with nearby schools including Collierville Elementary School, West Collierville Middle School, and Collierville High School.
Ownership History
Date
Name
Owned For
Owner Type
Purchase Details
Closed on
Jun 30, 2010
Sold by
Johnston James A
Bought by
Riley Kelly J and Riley Russell C
Current Estimated Value
Purchase Details
Closed on
Jul 25, 2007
Sold by
Va
Bought by
Johnston James A
Purchase Details
Closed on
Nov 27, 2006
Sold by
Young Edward M and Young Patricia D
Bought by
Va
Purchase Details
Closed on
Mar 28, 2002
Sold by
Benson Frank G
Bought by
Young Edward M and Young Patricia D
Home Financials for this Owner
Home Financials are based on the most recent Mortgage that was taken out on this home.
Original Mortgage
$150,689
Interest Rate
6.89%
Mortgage Type
VA
Purchase Details
Closed on
Jul 3, 2001
Sold by
Benson Catherine Ruthie
Bought by
Benson Frank G
Purchase Details
Closed on
Jan 14, 2000
Sold by
Harvey Jerry L and Harvey Wanda L
Bought by
Benson Frank G
Create a Home Valuation Report for This Property
The Home Valuation Report is an in-depth analysis detailing your home's value as well as a comparison with similar homes in the area
Home Values in the Area
Average Home Value in this Area
Purchase History
| Date | Buyer | Sale Price | Title Company |
|---|---|---|---|
| Riley Kelly J | -- | None Available | |
| Johnston James A | $162,000 | Real Estate Loan Svcs Tn Inc | |
| Va | $141,008 | None Available | |
| Young Edward M | $146,300 | -- | |
| Benson Frank G | -- | -- | |
| Benson Frank G | $139,900 | West Tn Title Insurance Agen |
Source: Public Records
Mortgage History
| Date | Status | Borrower | Loan Amount |
|---|---|---|---|
| Previous Owner | Young Edward M | $150,689 |
Source: Public Records
Tax History Compared to Growth
Tax History
| Year | Tax Paid | Tax Assessment Tax Assessment Total Assessment is a certain percentage of the fair market value that is determined by local assessors to be the total taxable value of land and additions on the property. | Land | Improvement |
|---|---|---|---|---|
| 2025 | $2,142 | $88,450 | $15,950 | $72,500 |
| 2024 | $2,142 | $63,175 | $8,150 | $55,025 |
| 2023 | $3,304 | $63,175 | $8,150 | $55,025 |
| 2022 | $3,228 | $63,175 | $8,150 | $55,025 |
| 2021 | $3,266 | $63,175 | $8,150 | $55,025 |
| 2020 | $2,794 | $47,525 | $8,150 | $39,375 |
| 2019 | $1,925 | $47,525 | $8,150 | $39,375 |
| 2018 | $1,925 | $47,525 | $8,150 | $39,375 |
| 2017 | $1,953 | $47,525 | $8,150 | $39,375 |
| 2016 | $1,836 | $42,025 | $0 | $0 |
| 2014 | $1,836 | $42,025 | $0 | $0 |
Source: Public Records
Map
Nearby Homes
- 230 W Powell Rd
- 276 Morton Rd
- 212 Anita Cove
- 895 Joe Dr
- 154 Bancroft Ave
- 607 Forestdale Dr
- 910 Sugar Cove
- 954 Wildbird Cove
- 475 Ginny Ln
- 549 Peterson Lake Rd
- 542 Country Springs Dr
- 182 E Powell Rd
- 142 W Nolley Dr
- 1082 Sugar Ln
- 208 E Pecan Valley St
- 1023 Greencliff Rd
- 250 S Monterey Mills Cove
- 378 Easonwood Ave
- 541 Carruthers Rd
- 135 Piperton Preserve Park
- 750 Joe Wood Cove
- 309 W Powell Rd
- 759 Joe Wood Cove
- 301 W Powell Rd
- 757 Florencewood Cove
- 319 W Powell Rd
- 749 Florencewood Cove
- 753 Joe Wood Cove
- 291 W Powell Rd
- 310 Florencewood Dr
- 329 W Powell Rd
- 328 Florencewood Dr
- 294 Florencewood Dr
- 279 W Powell Rd
- 756 Florencewood Cove
- 766 Memory Ln
- 338 Florencewood Dr
- 343 W Powell Rd
- 343 W Powell Rd
- 750 Florencewood Cove