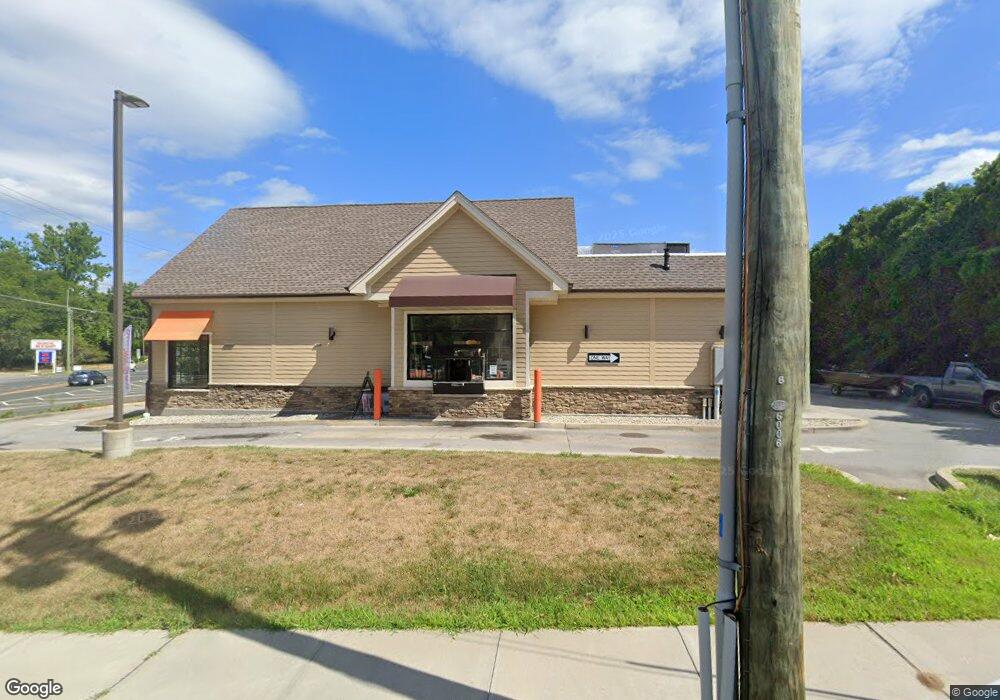
760 Main St Winsted, CT 06098
Studio
--
Bath
1,757
Sq Ft
24,829
Sq Ft Lot
About This Home
This home is located at 760 Main St, Winsted, CT 06098. 760 Main St is a home located in Litchfield County with nearby schools including Pearson School and Explorations Charter School.
Ownership History
Date
Name
Owned For
Owner Type
Purchase Details
Closed on
Feb 3, 2015
Sold by
Winsted Auto Center Ll
Bought by
760 Main Street Llc
Home Financials for this Owner
Home Financials are based on the most recent Mortgage that was taken out on this home.
Original Mortgage
$720,000
Outstanding Balance
$552,482
Interest Rate
3.81%
Mortgage Type
Commercial
Purchase Details
Closed on
Oct 2, 2000
Sold by
Smith Dell M and Smith Linda H
Bought by
Winsted Auto Cntr Llc
Home Financials for this Owner
Home Financials are based on the most recent Mortgage that was taken out on this home.
Original Mortgage
$180,000
Interest Rate
7.66%
Mortgage Type
Commercial
Create a Home Valuation Report for This Property
The Home Valuation Report is an in-depth analysis detailing your home's value as well as a comparison with similar homes in the area
Home Values in the Area
Average Home Value in this Area
Purchase History
| Date | Buyer | Sale Price | Title Company |
|---|---|---|---|
| 760 Main Street Llc | $375,000 | -- | |
| 760 Main Street Llc | $375,000 | -- | |
| Winsted Auto Cntr Llc | $280,000 | -- | |
| Winsted Auto Cntr Llc | $280,000 | -- |
Source: Public Records
Mortgage History
| Date | Status | Borrower | Loan Amount |
|---|---|---|---|
| Open | 760 Main Street Llc | $720,000 | |
| Closed | 760 Main Street Llc | $720,000 | |
| Previous Owner | Winsted Auto Cntr Llc | $180,000 |
Source: Public Records
Tax History
| Year | Tax Paid | Tax Assessment Tax Assessment Total Assessment is a certain percentage of the fair market value that is determined by local assessors to be the total taxable value of land and additions on the property. | Land | Improvement |
|---|---|---|---|---|
| 2025 | $16,039 | $549,850 | $173,390 | $376,460 |
| 2024 | $14,978 | $549,850 | $173,390 | $376,460 |
| 2023 | $14,511 | $549,850 | $173,390 | $376,460 |
| 2022 | $15,909 | $474,320 | $154,770 | $319,550 |
| 2021 | $15,909 | $474,320 | $154,770 | $319,550 |
| 2020 | $15,909 | $474,320 | $154,770 | $319,550 |
| 2019 | $15,909 | $474,320 | $154,770 | $319,550 |
| 2018 | $15,909 | $474,320 | $154,770 | $319,550 |
| 2017 | $15,528 | $462,980 | $154,770 | $308,210 |
| 2016 | $15,545 | $463,470 | $154,770 | $308,700 |
| 2015 | $4,635 | $141,750 | $83,580 | $58,170 |
| 2014 | $4,523 | $141,750 | $83,580 | $58,170 |
Source: Public Records
Map
Nearby Homes
Your Personal Tour Guide
Ask me questions while you tour the home.