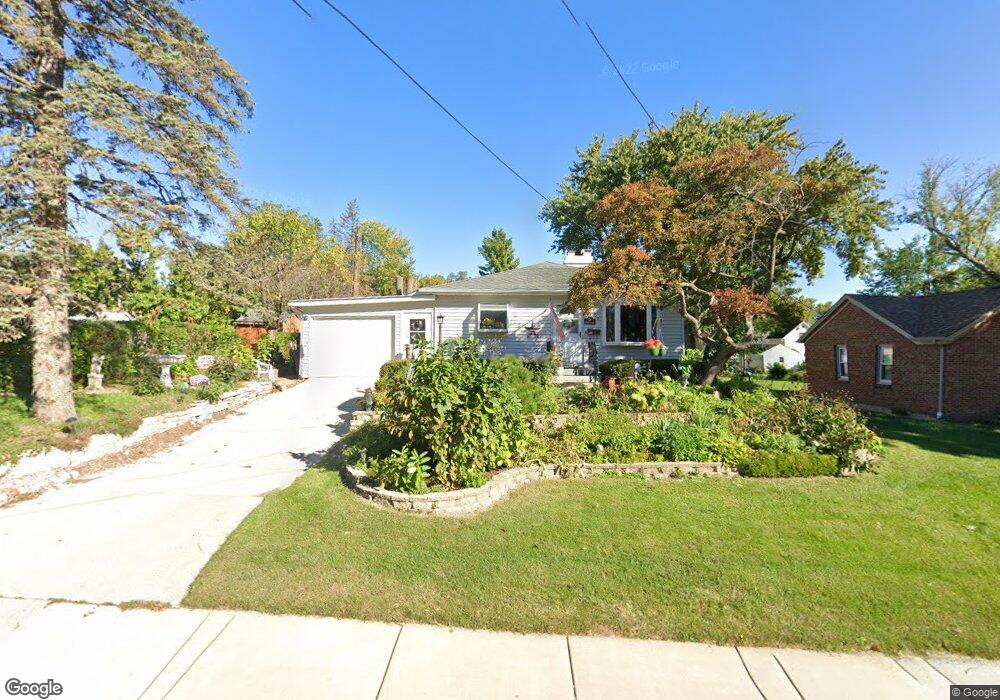
760 Morgan St Elgin, IL 60123
Southwest Elgin NeighborhoodEstimated Value: $269,000 - $289,000
3
Beds
1
Bath
1,212
Sq Ft
$231/Sq Ft
Est. Value
About This Home
This home is located at 760 Morgan St, Elgin, IL 60123 and is currently estimated at $280,552, approximately $231 per square foot. 760 Morgan St is a home located in Kane County with nearby schools including Lowrie Elementary School, Abbott Middle School, and Larkin High School.
Ownership History
Date
Name
Owned For
Owner Type
Purchase Details
Closed on
Jul 31, 2002
Sold by
Davenport Herbert and Davenport Rosalyn E
Bought by
Davenport Rosalyn E and Herbert & Rosalyn E Davenport Living Tr
Current Estimated Value
Create a Home Valuation Report for This Property
The Home Valuation Report is an in-depth analysis detailing your home's value as well as a comparison with similar homes in the area
Home Values in the Area
Average Home Value in this Area
Purchase History
| Date | Buyer | Sale Price | Title Company |
|---|---|---|---|
| Davenport Rosalyn E | -- | -- |
Source: Public Records
Tax History
| Year | Tax Paid | Tax Assessment Tax Assessment Total Assessment is a certain percentage of the fair market value that is determined by local assessors to be the total taxable value of land and additions on the property. | Land | Improvement |
|---|---|---|---|---|
| 2024 | $4,434 | $92,569 | $14,313 | $78,256 |
| 2023 | $5,765 | $83,629 | $12,931 | $70,698 |
| 2022 | $5,658 | $76,255 | $11,791 | $64,464 |
| 2021 | $5,379 | $71,293 | $11,024 | $60,269 |
| 2020 | $5,204 | $68,060 | $10,524 | $57,536 |
| 2019 | $5,028 | $64,832 | $10,025 | $54,807 |
| 2018 | $4,951 | $61,076 | $9,444 | $51,632 |
| 2017 | $4,807 | $57,739 | $8,928 | $48,811 |
| 2016 | $4,540 | $53,566 | $8,283 | $45,283 |
| 2015 | -- | $49,098 | $7,592 | $41,506 |
| 2014 | -- | $48,492 | $7,498 | $40,994 |
| 2013 | -- | $49,771 | $7,696 | $42,075 |
Source: Public Records
Map
Nearby Homes
- 800 Morgan St
- 835 Oak St
- 353 Wilcox Ave
- 400 Marguerite St
- 315 Vandalia St
- 756 Walnut Ave
- 761 South St
- 552 Walnut Ave
- 118 Wilcox Ave
- 208 Moseley St
- 331 Orange St
- 50 Sheridan St
- 161 S Aldine Ave
- 532 South St
- 78 S Edison Ave
- 262 S Weston Ave
- 70 S Weston Ave
- 44 Monroe St
- 96 S Crystal St
- 3 National St Unit 3
Your Personal Tour Guide
Ask me questions while you tour the home.