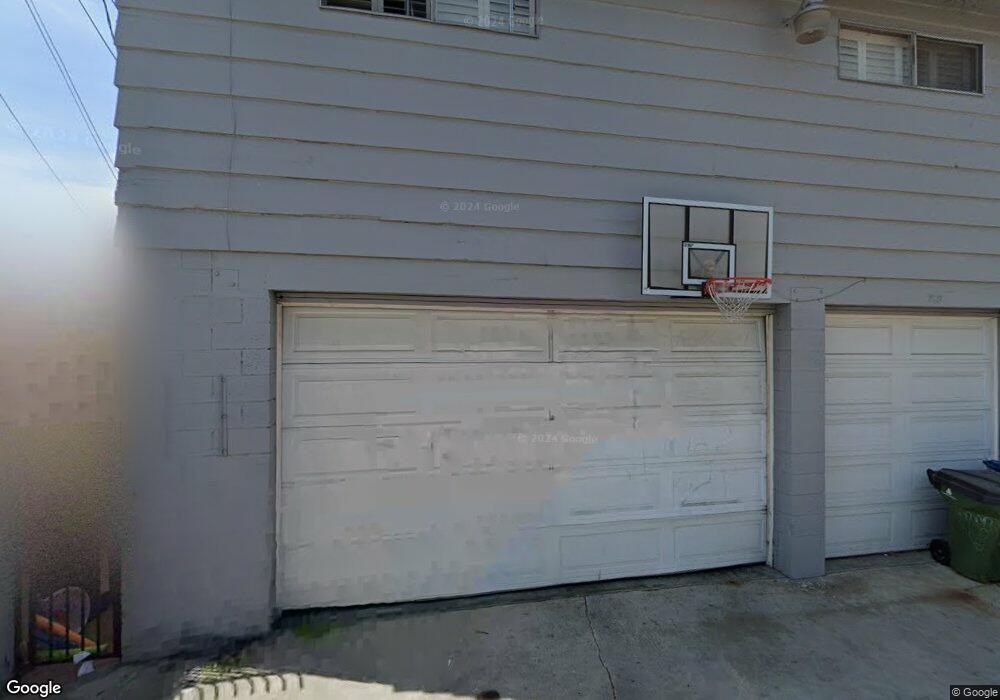
760 W 12th St San Pedro, CA 90731
Estimated Value: $807,000 - $935,589
3
Beds
2
Baths
1,696
Sq Ft
$513/Sq Ft
Est. Value
About This Home
This home is located at 760 W 12th St, San Pedro, CA 90731 and is currently estimated at $869,647, approximately $512 per square foot. 760 W 12th St is a home located in Los Angeles County with nearby schools including Cabrillo Avenue Elementary School, Dana Middle School, and San Pedro Senior High School.
Ownership History
Date
Name
Owned For
Owner Type
Purchase Details
Closed on
Nov 27, 2012
Sold by
Sanchez Gina M and Comparsi Gina M
Bought by
Sanchez Gina Marie and Sanchez William Gerald
Current Estimated Value
Purchase Details
Closed on
May 10, 2005
Sold by
Bennett Garrett Allen and Mendoza Armando
Bought by
Comparsi Gina M
Home Financials for this Owner
Home Financials are based on the most recent Mortgage that was taken out on this home.
Original Mortgage
$359,600
Interest Rate
5.87%
Mortgage Type
Fannie Mae Freddie Mac
Purchase Details
Closed on
Jul 31, 2004
Sold by
Rivera Patricia A and Rivera Julio
Bought by
Bennett Garrett Allen and Mendoza Armando
Home Financials for this Owner
Home Financials are based on the most recent Mortgage that was taken out on this home.
Original Mortgage
$344,000
Interest Rate
6%
Mortgage Type
Purchase Money Mortgage
Purchase Details
Closed on
Apr 25, 1994
Sold by
Rivera Julio and Rivera Patricia A
Bought by
Rivera Robin Lynn and Rivera Patricia A
Create a Home Valuation Report for This Property
The Home Valuation Report is an in-depth analysis detailing your home's value as well as a comparison with similar homes in the area
Home Values in the Area
Average Home Value in this Area
Purchase History
| Date | Buyer | Sale Price | Title Company |
|---|---|---|---|
| Sanchez Gina Marie | -- | Accommodation | |
| Comparsi Gina M | $489,000 | First American Title Company | |
| Bennett Garrett Allen | $430,000 | First American Title Company | |
| Rivera Robin Lynn | -- | -- |
Source: Public Records
Mortgage History
| Date | Status | Borrower | Loan Amount |
|---|---|---|---|
| Closed | Comparsi Gina M | $359,600 | |
| Previous Owner | Bennett Garrett Allen | $344,000 | |
| Closed | Comparsi Gina M | $31,600 |
Source: Public Records
Tax History Compared to Growth
Tax History
| Year | Tax Paid | Tax Assessment Tax Assessment Total Assessment is a certain percentage of the fair market value that is determined by local assessors to be the total taxable value of land and additions on the property. | Land | Improvement |
|---|---|---|---|---|
| 2025 | $8,686 | $715,097 | $545,289 | $169,808 |
| 2024 | $8,686 | $701,077 | $534,598 | $166,479 |
| 2023 | $8,519 | $687,331 | $524,116 | $163,215 |
| 2022 | $8,123 | $673,855 | $513,840 | $160,015 |
| 2021 | $8,020 | $660,643 | $503,765 | $156,878 |
| 2019 | $7,780 | $641,050 | $488,824 | $152,226 |
| 2018 | $7,688 | $628,482 | $479,240 | $149,242 |
| 2017 | $7,518 | $616,160 | $469,844 | $146,316 |
| 2016 | $7,341 | $604,080 | $460,632 | $143,448 |
| 2015 | $6,793 | $558,000 | $421,600 | $136,400 |
| 2014 | $5,587 | $446,000 | $337,000 | $109,000 |
Source: Public Records
Map
Nearby Homes
- 728 W 11th St
- 918 S Cabrillo Ave
- 782 W 14th St
- 884 W 11th St
- 1209 S Grand Ave Unit 1211
- 1311 S Grand Ave Unit 17
- 1311 S Grand Ave Unit 5
- 576 W 11th St
- 649 W 8th St
- 935 W 10th St
- 576 W 13th St
- 1316 S Grand Ave
- 573 W 13th St
- 972 W 12th St
- 620 W 8th St
- 392 W 7th St
- 1214 S Alma St Unit 4
- 660 W 7th St
- 1010 W 13th St
- 990 W 9th St