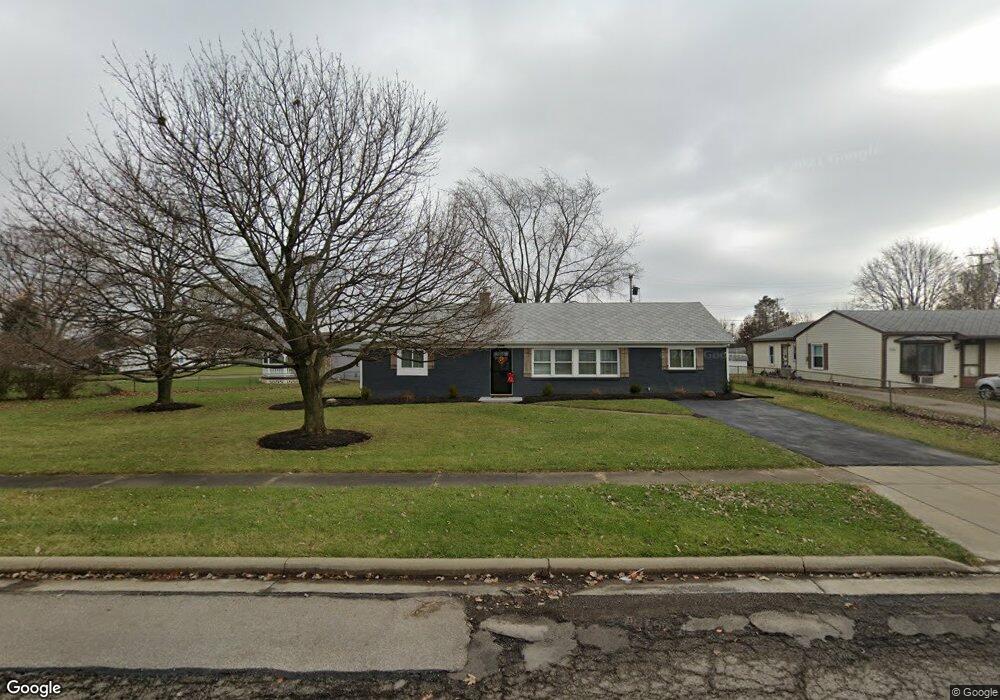
760 Willowood Dr W Ontario, OH 44906
Estimated Value: $167,000 - $184,954
3
Beds
2
Baths
1,350
Sq Ft
$131/Sq Ft
Est. Value
About This Home
This home is located at 760 Willowood Dr W, Ontario, OH 44906 and is currently estimated at $177,239, approximately $131 per square foot. 760 Willowood Dr W is a home located in Richland County with nearby schools including Stingel Elementary School, Ontario Middle School, and Ontario High School.
Ownership History
Date
Name
Owned For
Owner Type
Purchase Details
Closed on
Oct 12, 2021
Sold by
Muncy Jeremy N
Bought by
Jefferson Tim B
Current Estimated Value
Home Financials for this Owner
Home Financials are based on the most recent Mortgage that was taken out on this home.
Original Mortgage
$100,125
Outstanding Balance
$76,940
Interest Rate
2.1%
Mortgage Type
New Conventional
Estimated Equity
$100,299
Purchase Details
Closed on
Sep 25, 2015
Sold by
Rader Richard L and Rader Tiffany A
Bought by
Muncy Jeremy N
Home Financials for this Owner
Home Financials are based on the most recent Mortgage that was taken out on this home.
Original Mortgage
$30,400
Interest Rate
4.64%
Mortgage Type
Adjustable Rate Mortgage/ARM
Purchase Details
Closed on
Aug 18, 2015
Sold by
Estate Of Patricia A Rader
Bought by
Rader Richard L
Home Financials for this Owner
Home Financials are based on the most recent Mortgage that was taken out on this home.
Original Mortgage
$30,400
Interest Rate
4.64%
Mortgage Type
Adjustable Rate Mortgage/ARM
Create a Home Valuation Report for This Property
The Home Valuation Report is an in-depth analysis detailing your home's value as well as a comparison with similar homes in the area
Home Values in the Area
Average Home Value in this Area
Purchase History
| Date | Buyer | Sale Price | Title Company |
|---|---|---|---|
| Jefferson Tim B | $133,500 | Southern Title | |
| Muncy Jeremy N | $45,000 | Chicago Title | |
| Rader Richard L | -- | Attorney |
Source: Public Records
Mortgage History
| Date | Status | Borrower | Loan Amount |
|---|---|---|---|
| Open | Jefferson Tim B | $100,125 | |
| Previous Owner | Muncy Jeremy N | $30,400 |
Source: Public Records
Tax History Compared to Growth
Tax History
| Year | Tax Paid | Tax Assessment Tax Assessment Total Assessment is a certain percentage of the fair market value that is determined by local assessors to be the total taxable value of land and additions on the property. | Land | Improvement |
|---|---|---|---|---|
| 2024 | $2,364 | $47,430 | $15,200 | $32,230 |
| 2023 | $2,364 | $47,430 | $15,200 | $32,230 |
| 2022 | $1,672 | $28,870 | $10,730 | $18,140 |
| 2021 | $1,711 | $28,870 | $10,730 | $18,140 |
| 2020 | $1,827 | $28,870 | $10,730 | $18,140 |
| 2019 | $1,710 | $24,460 | $9,090 | $15,370 |
| 2018 | $1,458 | $24,460 | $9,090 | $15,370 |
| 2017 | $1,399 | $24,460 | $9,090 | $15,370 |
| 2016 | $1,363 | $23,090 | $8,630 | $14,460 |
| 2015 | $1,363 | $23,090 | $8,630 | $14,460 |
| 2014 | $1,329 | $23,090 | $8,630 | $14,460 |
| 2012 | $604 | $23,100 | $9,090 | $14,010 |
Source: Public Records
Map
Nearby Homes
- 2007 Teakwood Dr
- 2010 Teakwood Dr
- 1947 Teakwood Dr
- 648 Villa Dr Unit 648
- 655 Villa Dr
- 1915 Teakwood Dr Unit 1915
- 1909 Teakwood Dr
- 700 Villa Dr
- 2270 Ferguson Rd
- 720 Lindaire Ln E
- 1996 Park Ave W
- 2583 Deerfield Ln
- 1980 Walker Lake Rd
- 2281 Park Ave W
- 2585 Deerfield Ln
- 1496 W 4th St
- 125 Hilltop Rd
- 99 Scotland Blvd
- 1431 Silver Ln
- 0 Spring Village Ln
- 756 Willowood Dr W
- 2083 Willowood Dr S
- 380 Willowood Dr W
- 2075 Willowood Dr S
- 2125 Rosewood Dr
- 2089 Rosewood Dr
- 2069 Willowood Dr S
- 381 Willowood Dr W
- 2084 W 4th St
- 2060 Willowood Dr S
- 2122 Rosewood Dr
- 2063 Willowood Dr S
- 2076 W 4th St
- 2081 Rosewood Dr
- 2054 Willowood Dr S
- 2096 Rosewood Dr
- 2143 Rosewood Dr
- 2057 Willowood Dr S
- 2068 W 4th St
- 2075 Rosewood Dr