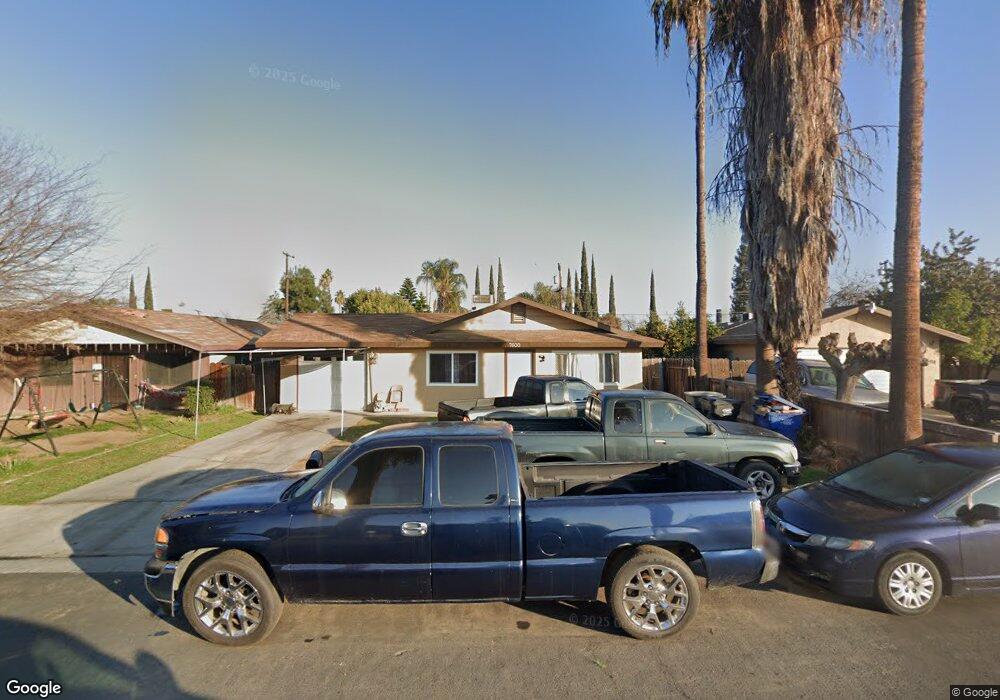
7600 Burger Way Lamont, CA 93241
Estimated Value: $247,000 - $299,000
3
Beds
2
Baths
1,148
Sq Ft
$239/Sq Ft
Est. Value
About This Home
This home is located at 7600 Burger Way, Lamont, CA 93241 and is currently estimated at $274,143, approximately $238 per square foot. 7600 Burger Way is a home located in Kern County with nearby schools including Alicante Avenue Elementary School, Mountain View Middle School, and Arvin High School.
Ownership History
Date
Name
Owned For
Owner Type
Purchase Details
Closed on
Jan 13, 2015
Sold by
Perez Emiliano
Bought by
Iron Door Properties #2 Llc
Current Estimated Value
Purchase Details
Closed on
May 7, 2009
Sold by
Citibank Na
Bought by
Perez Emiliano
Purchase Details
Closed on
Apr 6, 2009
Sold by
Moreno Jose M and Herrera Denise
Bought by
Citibank Na and Structured Asset Mortgage Inevestments I
Purchase Details
Closed on
Apr 6, 2006
Sold by
Padilla Jose
Bought by
Moreno Jose M and Herrera Denise
Home Financials for this Owner
Home Financials are based on the most recent Mortgage that was taken out on this home.
Original Mortgage
$184,000
Interest Rate
8.25%
Mortgage Type
Purchase Money Mortgage
Purchase Details
Closed on
Dec 20, 2005
Sold by
Padilla Martha
Bought by
Padilla Jose
Purchase Details
Closed on
Dec 7, 2005
Sold by
Peters Carolyn L
Bought by
Padilla Jose
Create a Home Valuation Report for This Property
The Home Valuation Report is an in-depth analysis detailing your home's value as well as a comparison with similar homes in the area
Home Values in the Area
Average Home Value in this Area
Purchase History
| Date | Buyer | Sale Price | Title Company |
|---|---|---|---|
| Iron Door Properties #2 Llc | -- | None Available | |
| Perez Emiliano | $65,000 | Fidelity National Title | |
| Citibank Na | $201,763 | None Available | |
| Moreno Jose M | $230,000 | Chicago Title Company | |
| Padilla Jose | -- | Chicago Title | |
| Padilla Jose | $140,000 | Chicago Title |
Source: Public Records
Mortgage History
| Date | Status | Borrower | Loan Amount |
|---|---|---|---|
| Previous Owner | Moreno Jose M | $184,000 |
Source: Public Records
Tax History Compared to Growth
Tax History
| Year | Tax Paid | Tax Assessment Tax Assessment Total Assessment is a certain percentage of the fair market value that is determined by local assessors to be the total taxable value of land and additions on the property. | Land | Improvement |
|---|---|---|---|---|
| 2025 | $1,474 | $83,684 | $25,745 | $57,939 |
| 2024 | $1,474 | $82,044 | $25,241 | $56,803 |
| 2023 | $1,472 | $80,437 | $24,747 | $55,690 |
| 2022 | $1,405 | $78,861 | $24,262 | $54,599 |
| 2021 | $1,372 | $77,316 | $23,787 | $53,529 |
| 2020 | $1,331 | $76,525 | $23,544 | $52,981 |
| 2019 | $1,321 | $76,525 | $23,544 | $52,981 |
| 2018 | $1,279 | $73,556 | $22,631 | $50,925 |
| 2017 | $1,252 | $72,115 | $22,188 | $49,927 |
| 2016 | $1,204 | $70,702 | $21,753 | $48,949 |
| 2015 | $1,192 | $69,641 | $21,427 | $48,214 |
| 2014 | $1,180 | $68,278 | $21,008 | $47,270 |
Source: Public Records
Map
Nearby Homes
- 7805 Panama Rd
- 10004 ElMcO Ave
- 8204 Gail Marie Dr
- 7916 Hall Rd
- 8309 Paradise Rd
- 9900 Myrtle Ave
- 8417 Montal St
- 9801 Houston Ave
- 10912 Santa Clara St
- 8712 Gail Marie Dr
- 0 Apn 17407012 Unit SR25015440
- 8900 Hope Ln
- 10413 Tatum St
- 10424 Habecker Rd
- 10810 Williams St
- 9917 Lenore St
- 7901 Jay St
- 11317 Rose St
- 8752 Far Hills Ave
- 11417 Lowe St
- 7520 Burger Way
- 7608 Burger Way
- 7516 Burger Way
- 7605 Delight Ave
- 7609 Delight Ave
- 7512 Burger Way
- 7616 Burger Way
- 7517 Delight Ave
- 7601 Burger Way
- 7617 Delight Ave
- 7605 Burger Way
- 7517 Burger Way
- 7508 Burger Way
- 7620 Burger Way
- 7609 Burger Way
- 7513 Burger Way
- 7509 Delight Ave
- 7504 Burger Way
- 7621 Delight Ave
- 7624 Burger Way