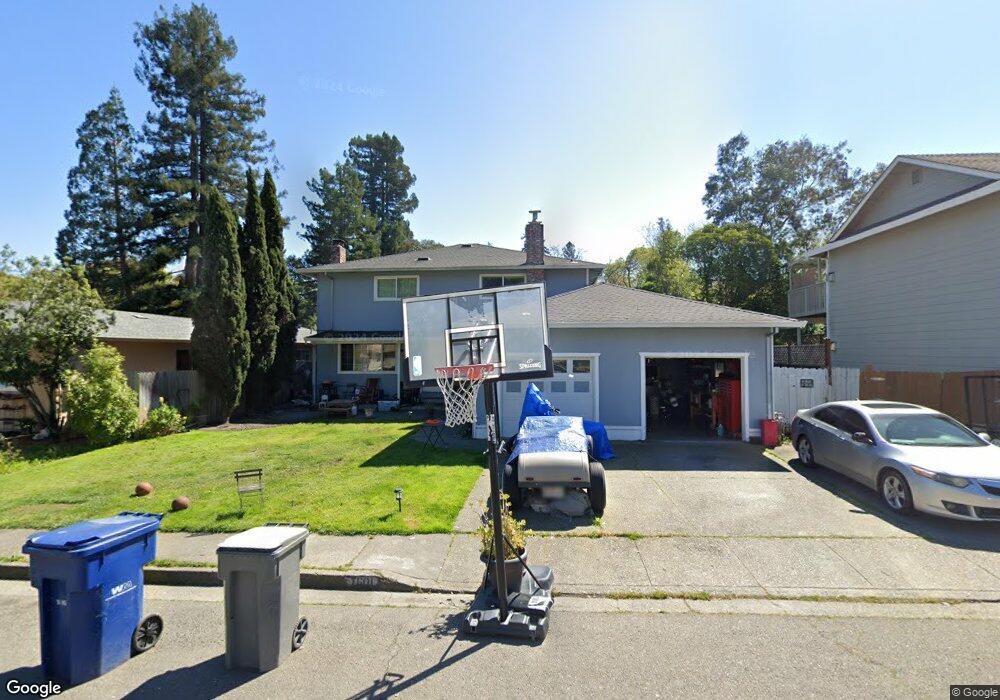
7601 Bately Ct Sebastopol, CA 95472
Estimated Value: $695,000 - $1,257,000
6
Beds
3
Baths
2,508
Sq Ft
$387/Sq Ft
Est. Value
About This Home
This home is located at 7601 Bately Ct, Sebastopol, CA 95472 and is currently estimated at $970,154, approximately $386 per square foot. 7601 Bately Ct is a home located in Sonoma County with nearby schools including Park Side Elementary School, Brook Haven Elementary School, and Analy High School.
Ownership History
Date
Name
Owned For
Owner Type
Purchase Details
Closed on
May 10, 2016
Sold by
Shaffer Monica
Bought by
Shaffer Monica and Monica Shaffer 2016 Trust
Current Estimated Value
Purchase Details
Closed on
Sep 9, 2008
Sold by
Shaffer Monica and Paulekas Sue Anne
Bought by
Shaffer Monica
Purchase Details
Closed on
Jun 10, 1999
Sold by
Shaffer Leonard
Bought by
Shaffer Leonard and The Leonard Shaffer 1991 Trust
Purchase Details
Closed on
Mar 29, 1999
Sold by
Schulze Klaus E and Schulze Rosina
Bought by
Shaffer Leonard
Home Financials for this Owner
Home Financials are based on the most recent Mortgage that was taken out on this home.
Original Mortgage
$120,000
Outstanding Balance
$27,281
Interest Rate
6.79%
Mortgage Type
Stand Alone First
Estimated Equity
$942,873
Purchase Details
Closed on
Apr 3, 1997
Sold by
Schulze Klaus E and Schulze Rosina
Bought by
Schulze Klaus E and Schulze Rosina
Create a Home Valuation Report for This Property
The Home Valuation Report is an in-depth analysis detailing your home's value as well as a comparison with similar homes in the area
Home Values in the Area
Average Home Value in this Area
Purchase History
| Date | Buyer | Sale Price | Title Company |
|---|---|---|---|
| Shaffer Monica | -- | None Available | |
| Shaffer Monica | -- | None Available | |
| Shaffer Leonard | -- | -- | |
| Shaffer Leonard | $245,000 | First American Title | |
| Schulze Klaus E | -- | -- | |
| Schulze Klaus E | -- | -- |
Source: Public Records
Mortgage History
| Date | Status | Borrower | Loan Amount |
|---|---|---|---|
| Open | Shaffer Leonard | $120,000 |
Source: Public Records
Tax History
| Year | Tax Paid | Tax Assessment Tax Assessment Total Assessment is a certain percentage of the fair market value that is determined by local assessors to be the total taxable value of land and additions on the property. | Land | Improvement |
|---|---|---|---|---|
| 2025 | $4,609 | $384,079 | $109,731 | $274,348 |
| 2024 | $4,609 | $376,549 | $107,580 | $268,969 |
| 2023 | $4,609 | $369,167 | $105,471 | $263,696 |
| 2022 | $4,463 | $361,929 | $103,403 | $258,526 |
| 2021 | $4,437 | $354,833 | $101,376 | $253,457 |
| 2020 | $4,373 | $351,196 | $100,337 | $250,859 |
| 2019 | $4,262 | $344,311 | $98,370 | $245,941 |
| 2018 | $4,206 | $337,561 | $96,442 | $241,119 |
| 2017 | $4,019 | $330,943 | $94,551 | $236,392 |
| 2016 | $3,921 | $324,455 | $92,698 | $231,757 |
| 2015 | $3,802 | $319,582 | $91,306 | $228,276 |
| 2014 | $3,742 | $313,323 | $89,518 | $223,805 |
Source: Public Records
Map
Nearby Homes
- 7859 Anthony St
- 7720 Bodega Ave Unit 3
- 7225 Bodega Ave
- 5200 California 116
- 200 Pleasant Hill Ave N
- 8091 Hill Dr
- 8086 Bodega Ave
- 8148 Bodega Ave
- Plan 5 at The Canopy
- Plan 3 at The Canopy
- Plan 4 at The Canopy
- Plan 1 at The Canopy
- Plan 6 at The Canopy
- 789 Pleasant Hill Rd
- 1220 Gravenstein Hwy N
- 5301 Gravenstein Hwy S
- 0 Bodega Hwy
- 7251 Fircrest Ave
- 6781 Evergreen Ave
- 1171 Gravenstein Hwy S
- 7611 Bately Ct
- 7591 Bately Ct
- 7621 Bately Ct
- 7600 Bately Ct
- 7590 Bately Ct
- 7610 Bately Ct
- 7580 Bately Ct
- 7631 Bately Ct
- 7620 Bately Ct
- 370 Neva St
- 385 Murphy Ave Unit 304
- 385 Murphy Ave Unit na
- 7630 Bately Ct Unit 1
- 7630 Bately Ct
- 7641 Bately Ct
- 7640 Bately Ct
- 360 Neva St
- 361 Jesse St
- 468 Florence Ave
- 361 Neva St