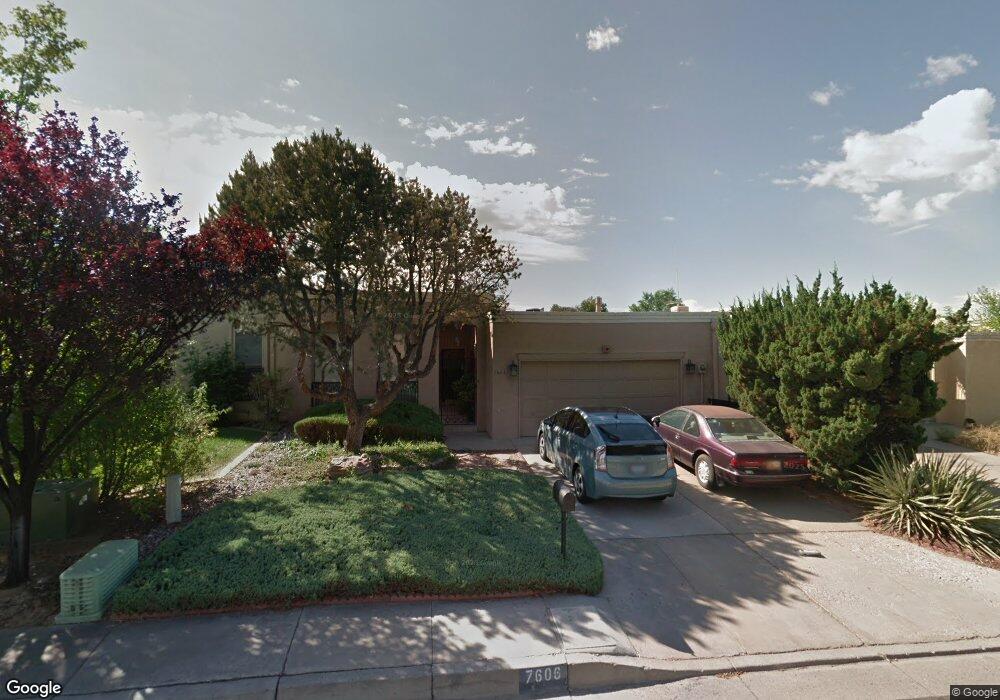
7606 La Madera Rd NE Albuquerque, NM 87109
Bear Canyon NeighborhoodEstimated Value: $360,000 - $386,000
2
Beds
2
Baths
1,786
Sq Ft
$210/Sq Ft
Est. Value
About This Home
This home is located at 7606 La Madera Rd NE, Albuquerque, NM 87109 and is currently estimated at $375,408, approximately $210 per square foot. 7606 La Madera Rd NE is a home located in Bernalillo County with nearby schools including Osuna Elementary School, Madison Middle School, and Sandia High School.
Ownership History
Date
Name
Owned For
Owner Type
Purchase Details
Closed on
Mar 26, 2010
Sold by
Eden Gorden
Bought by
Stockton J B and Broyles Linda L
Current Estimated Value
Home Financials for this Owner
Home Financials are based on the most recent Mortgage that was taken out on this home.
Original Mortgage
$177,500
Interest Rate
5.5%
Mortgage Type
Seller Take Back
Purchase Details
Closed on
Aug 12, 2004
Sold by
Ross Mark
Bought by
Bennett Ii John N and Bennett Judith R
Home Financials for this Owner
Home Financials are based on the most recent Mortgage that was taken out on this home.
Original Mortgage
$66,500
Interest Rate
5%
Mortgage Type
Seller Take Back
Purchase Details
Closed on
Jun 30, 2003
Sold by
Villella Patrick S and Villella Judy K
Bought by
Villella Patrick S and Villella Judy K
Purchase Details
Closed on
Jun 27, 2001
Sold by
Gillette Jean M
Bought by
Ross Mark
Home Financials for this Owner
Home Financials are based on the most recent Mortgage that was taken out on this home.
Original Mortgage
$68,750
Interest Rate
7.11%
Create a Home Valuation Report for This Property
The Home Valuation Report is an in-depth analysis detailing your home's value as well as a comparison with similar homes in the area
Home Values in the Area
Average Home Value in this Area
Purchase History
| Date | Buyer | Sale Price | Title Company |
|---|---|---|---|
| Stockton J B | $252,500 | Old Republic Title Company | |
| Bennett Ii John N | $165,000 | Albuquerque Title Co Inc | |
| Villella Patrick S | -- | -- | |
| Ross Mark | -- | Albuquerque Title Co Inc |
Source: Public Records
Mortgage History
| Date | Status | Borrower | Loan Amount |
|---|---|---|---|
| Closed | Stockton J B | $177,500 | |
| Closed | Bennett Ii John N | $66,500 | |
| Closed | Ross Mark | $68,750 |
Source: Public Records
Tax History Compared to Growth
Tax History
| Year | Tax Paid | Tax Assessment Tax Assessment Total Assessment is a certain percentage of the fair market value that is determined by local assessors to be the total taxable value of land and additions on the property. | Land | Improvement |
|---|---|---|---|---|
| 2025 | $2,941 | $71,799 | $21,051 | $50,748 |
| 2024 | $2,941 | $69,708 | $20,438 | $49,270 |
| 2023 | $2,892 | $67,679 | $19,843 | $47,836 |
| 2022 | $2,795 | $65,707 | $19,265 | $46,442 |
| 2021 | $2,701 | $63,794 | $18,704 | $45,090 |
| 2020 | $2,657 | $61,936 | $18,159 | $43,777 |
| 2019 | $2,579 | $60,133 | $17,631 | $42,502 |
| 2018 | $2,487 | $60,133 | $17,631 | $42,502 |
| 2017 | $2,410 | $58,381 | $17,117 | $41,264 |
| 2016 | $2,341 | $55,031 | $16,135 | $38,896 |
| 2015 | $53,428 | $53,428 | $15,665 | $37,763 |
| 2014 | $2,293 | $53,995 | $15,665 | $38,330 |
| 2013 | -- | $53,009 | $15,654 | $37,355 |
Source: Public Records
Map
Nearby Homes
- 6101 Quemado Dr NE
- 5812 Torreon Dr NE
- 7542 Bear Canyon Rd NE
- 7540 Bear Canyon Rd NE
- 5605 Fair Oak Trail NE
- 5601 Dogwood Trail NE
- 7416 El Morro Rd NE
- 7933 Academy Trail NE
- 7503 Lamplighter Ln NE
- 6432 Truchas Dr NE
- 6221 Truchas Dr NE
- 6808 Frantz Dr NE
- 6820 Frantz Dr NE
- 7000 Esther Ave NE
- 6904 Esther Ave NE
- 6900 Esther Ave NE
- 7001 Beck Dr NE
- 6800 Orphelia Ave NE
- 6800 Esther Ave NE
- 6700 Esther Ave NE
- 7604 La Madera Rd NE
- 7610 La Madera Rd NE
- 7602 La Madera Rd NE
- 5927 Quemado Dr NE
- 6001 Quemado Dr NE
- 5919 Cubero Dr NE
- 5925 Quemado Dr NE
- 5917 Cubero Dr NE
- 5923 Quemado Dr NE
- 6000 Torreon Dr NE
- 5920 Torreon Dr NE
- 5918 Torreon Dr NE
- 6005 Quemado Dr NE
- 5921 Quemado Dr NE
- 5916 Torreon Dr NE
- 5915 Cubero Dr NE
- 6001 Vista Campo Rd NE
- 6009 Quemado Dr NE
- 5913 Cubero Dr NE
- 6008 Quemado Dr NE