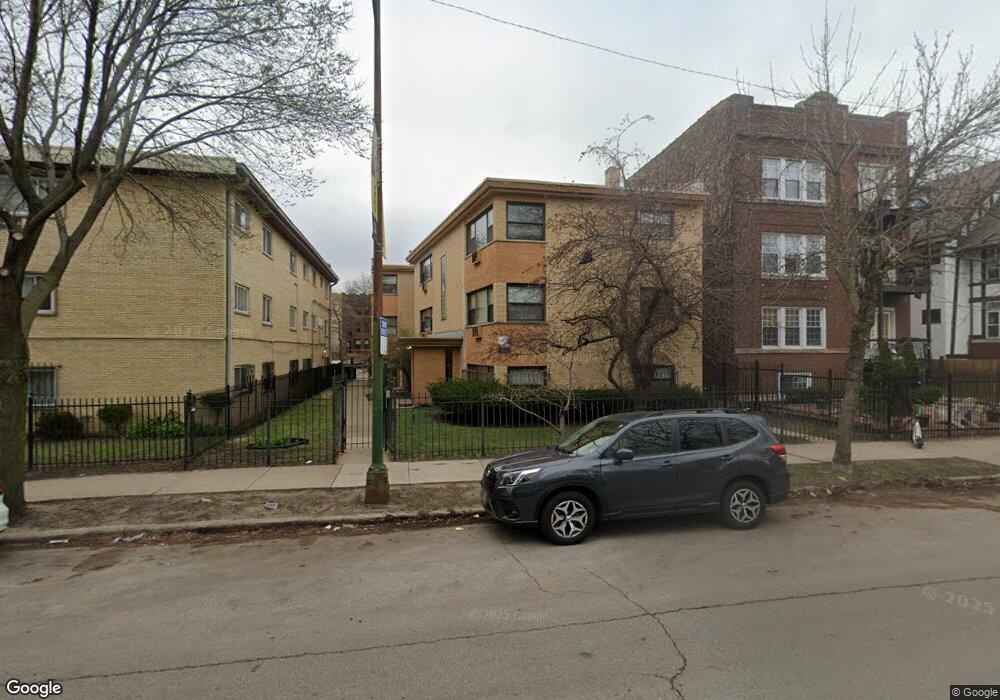
7608 N Rogers Ave Unit G3 Chicago, IL 60626
Rogers Park NeighborhoodEstimated Value: $116,000 - $148,000
--
Bed
--
Bath
20,955
Sq Ft
$6/Sq Ft
Est. Value
About This Home
This home is located at 7608 N Rogers Ave Unit G3, Chicago, IL 60626 and is currently estimated at $129,277, approximately $6 per square foot. 7608 N Rogers Ave Unit G3 is a home located in Cook County with nearby schools including Gale Elementary Community Academy, Sullivan High School, and Acero - Sor Juana Ines de la Cruz School.
Ownership History
Date
Name
Owned For
Owner Type
Purchase Details
Closed on
Apr 26, 2022
Sold by
Fagbemi Adebola and Fagbemi Adebole T
Bought by
7608 N Rogers Llc
Current Estimated Value
Purchase Details
Closed on
Oct 15, 2020
Sold by
Yassin Tuohir A
Bought by
Fagbemi Adebola
Purchase Details
Closed on
Dec 11, 2013
Sold by
Federal National Mortgage Association
Bought by
Yassin Tuoshi A
Purchase Details
Closed on
Mar 13, 2013
Sold by
Sloan Rosemary C
Bought by
Federal National Mortgage Association
Purchase Details
Closed on
Apr 28, 2005
Sold by
Siniakowicz Roman
Bought by
Sloan Rosemary C
Home Financials for this Owner
Home Financials are based on the most recent Mortgage that was taken out on this home.
Original Mortgage
$108,000
Interest Rate
6.13%
Mortgage Type
New Conventional
Create a Home Valuation Report for This Property
The Home Valuation Report is an in-depth analysis detailing your home's value as well as a comparison with similar homes in the area
Home Values in the Area
Average Home Value in this Area
Purchase History
| Date | Buyer | Sale Price | Title Company |
|---|---|---|---|
| 7608 N Rogers Llc | $939,000 | -- | |
| 7608 N Rogers Llc | -- | None Listed On Document | |
| Fagbemi Adebola | $80,000 | Chicago Title | |
| Yassin Tuoshi A | -- | First American Title Ins Co | |
| Federal National Mortgage Association | -- | Ticor Title Insurance Compan | |
| Sloan Rosemary C | $135,000 | -- |
Source: Public Records
Mortgage History
| Date | Status | Borrower | Loan Amount |
|---|---|---|---|
| Previous Owner | Sloan Rosemary C | $108,000 | |
| Closed | Sloan Rosemary C | $20,250 |
Source: Public Records
Tax History Compared to Growth
Tax History
| Year | Tax Paid | Tax Assessment Tax Assessment Total Assessment is a certain percentage of the fair market value that is determined by local assessors to be the total taxable value of land and additions on the property. | Land | Improvement |
|---|---|---|---|---|
| 2024 | $1,266 | $11,230 | $1,769 | $9,461 |
| 2023 | $1,234 | $6,000 | $1,415 | $4,585 |
| 2022 | $1,234 | $6,000 | $1,415 | $4,585 |
| 2021 | $1,206 | $5,999 | $1,414 | $4,585 |
| 2020 | $168 | $3,856 | $1,221 | $2,635 |
| 2019 | $171 | $4,281 | $1,221 | $3,060 |
| 2018 | $167 | $4,281 | $1,221 | $3,060 |
| 2017 | $262 | $4,591 | $1,093 | $3,498 |
| 2016 | $419 | $4,591 | $1,093 | $3,498 |
| 2015 | $361 | $4,591 | $1,093 | $3,498 |
| 2014 | $832 | $7,051 | $1,061 | $5,990 |
| 2013 | $804 | $7,051 | $1,061 | $5,990 |
Source: Public Records
Map
Nearby Homes
- 7639 N Greenview Ave Unit 1E
- 7637 N Bosworth Ave Unit 2N
- 7637 N Bosworth Ave Unit 3S
- 7555 N Rogers Ave
- 7612 N Eastlake Terrace Unit 3N
- 1511 W Birchwood Ave Unit 1F
- 7625 N Eastlake Terrace Unit 104
- 7641 N Eastlake Terrace Unit 1B
- 7708 N Ashland Ave
- 7756 N Sheridan Rd Unit 16
- 7711 N Marshfield Ave Unit 1
- 1533 W Fargo Ave Unit 1W
- 1628 W Juneway Terrace Unit 1
- 1321 W Fargo Ave Unit 2E
- 7730 N Paulina St Unit 1
- 1206 W Jarvis Ave Unit 1S
- 7311 N Ashland Blvd Unit 2A
- 7311 N Ashland Blvd Unit 1B
- 1600 W Chase Ave Unit 3B
- 7321 N Paulina St Unit 73212
- 7608 N Rogers Ave Unit G2
- 7608 N Rogers Ave Unit 102
- 7608 N Rogers Ave Unit G1
- 7608 N Rogers Ave Unit 201
- 7608 N Rogers Ave Unit 202
- 7608 N Rogers Ave Unit 101
- 7608 N Rogers Ave
- 7610 N Rogers Ave Unit G3
- 7610 N Rogers Ave Unit 104
- 7610 N Rogers Ave Unit 101
- 7610 N Rogers Ave Unit 204
- 7610 N Rogers Ave Unit 201
- 7610 N Rogers Ave Unit 103
- 7610 N Rogers Ave Unit 203
- 7610 N Rogers Ave Unit G2
- 7610 N Rogers Ave Unit 102
- 7610 N Rogers Ave Unit 301
- 7610 N Rogers Ave
- 7612 N Rogers Ave Unit 1
- 7612 N Rogers Ave Unit 2