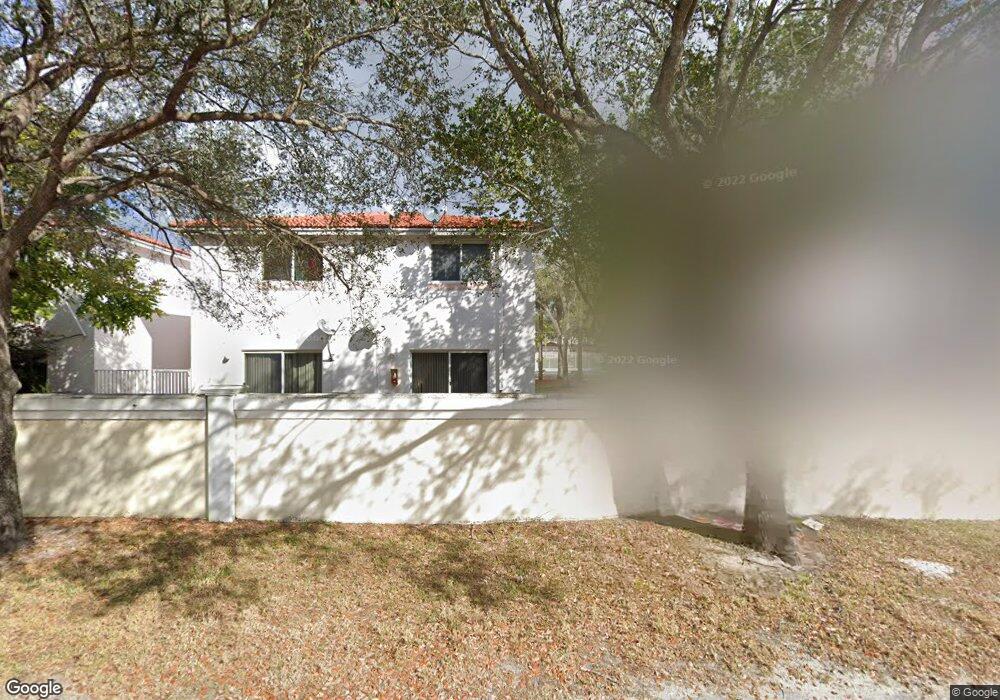
7609 Tamarac Island Cir Unit 7609 Tamarac, FL 33321
Estimated Value: $309,000 - $357,000
4
Beds
3
Baths
1,404
Sq Ft
$239/Sq Ft
Est. Value
About This Home
This home is located at 7609 Tamarac Island Cir Unit 7609, Tamarac, FL 33321 and is currently estimated at $335,677, approximately $239 per square foot. 7609 Tamarac Island Cir Unit 7609 is a home located in Broward County with nearby schools including Tamarac Elementary School, Millennium 6-12 Collegiate Academy, and J. P. Taravella High School.
Ownership History
Date
Name
Owned For
Owner Type
Purchase Details
Closed on
Feb 1, 2014
Sold by
Payan Paula J
Bought by
Musso Fiorella Paola Giusti
Current Estimated Value
Purchase Details
Closed on
Jan 13, 2009
Sold by
Rusnak John E and Rusnak Margaret E
Bought by
Payan Paula J
Home Financials for this Owner
Home Financials are based on the most recent Mortgage that was taken out on this home.
Original Mortgage
$174,055
Interest Rate
5.24%
Mortgage Type
FHA
Purchase Details
Closed on
Aug 29, 2001
Sold by
Oceanic Rose Developer Inc
Bought by
Rusnak John E and Rusnak Margaret E
Home Financials for this Owner
Home Financials are based on the most recent Mortgage that was taken out on this home.
Original Mortgage
$116,900
Interest Rate
7.02%
Create a Home Valuation Report for This Property
The Home Valuation Report is an in-depth analysis detailing your home's value as well as a comparison with similar homes in the area
Home Values in the Area
Average Home Value in this Area
Purchase History
| Date | Buyer | Sale Price | Title Company |
|---|---|---|---|
| Musso Fiorella Paola Giusti | $172,000 | Attorney | |
| Payan Paula J | $175,000 | Nationwide Land Title Inc | |
| Rusnak John E | $129,500 | -- |
Source: Public Records
Mortgage History
| Date | Status | Borrower | Loan Amount |
|---|---|---|---|
| Previous Owner | Payan Paula J | $174,055 | |
| Previous Owner | Rusnak John E | $116,900 |
Source: Public Records
Tax History Compared to Growth
Tax History
| Year | Tax Paid | Tax Assessment Tax Assessment Total Assessment is a certain percentage of the fair market value that is determined by local assessors to be the total taxable value of land and additions on the property. | Land | Improvement |
|---|---|---|---|---|
| 2025 | $7,053 | $293,310 | $29,330 | $263,980 |
| 2024 | $6,635 | $293,310 | $29,330 | $263,980 |
| 2023 | $6,635 | $265,360 | $0 | $0 |
| 2022 | $5,900 | $241,240 | $0 | $0 |
| 2021 | $5,460 | $219,310 | $0 | $0 |
| 2020 | $5,043 | $201,310 | $20,130 | $181,180 |
| 2019 | $4,663 | $181,260 | $18,130 | $163,130 |
| 2018 | $4,797 | $190,020 | $19,000 | $171,020 |
| 2017 | $4,632 | $180,000 | $0 | $0 |
| 2016 | $4,462 | $164,360 | $0 | $0 |
| 2015 | $4,048 | $149,420 | $0 | $0 |
| 2014 | $3,123 | $102,910 | $0 | $0 |
| 2013 | -- | $93,560 | $9,360 | $84,200 |
Source: Public Records
Map
Nearby Homes
- 7659 NW 74th Ave
- 7391 NW 76th St
- 7500 NW 75th St
- 7611 NW 72nd Way
- 7830 N University Dr
- 7222 Primrose Ln
- 7906 NW 75th Ave
- 7421 NW 72nd Ave
- 7609 NW 70th Ave
- 7001 NW 76th Ct
- 7680 NW 79th Ave Unit P1
- 7105 NW 73rd Ave
- 8009 NW 71st Ct
- 7780 NW 79th Ave Unit F6
- 7610 NW 79th Ave Unit I5
- 7720 NW 79th Ave Unit B2
- 7720 NW 79th Ave Unit B6
- 7750 NW 79th Ave Unit H4
- 7750 NW 79th Ave Unit H5
- 7670 NW 79th Ave Unit O5
- 7663 Tamarac Island Cir Unit 7663
- 7609 Tamarac Island Cir Unit 7609
- 7613 Tamarac Island Cir Unit 7613
- 7613 Tamarac Island Cir Unit B7613
- 7615 Tamarac Island Cir Unit 7615
- 7669 Tamarac Island Cir Unit 7669
- 7679 Tamarac Island Cir
- 7649 Tamarac Island Cir Unit 7649
- 7653 Tamarac Island Cir
- 7643 Tamarac Island Cir Unit 7643
- 7663 Tamarac Island Cir Unit 7663
- 7629 Tamarac Island Cir Unit 7629
- 7651 Tamarac Island Cir Unit 7651
- 7689 Tamarac Island Cir Unit 7689
- 7659 Tamarac Island Cir
- 7623 Tamarac Island Cir Unit 7623
- 7617 Tamarac Island Cir Unit 7617
- 7611 Tamarac Island Cir Unit 7611