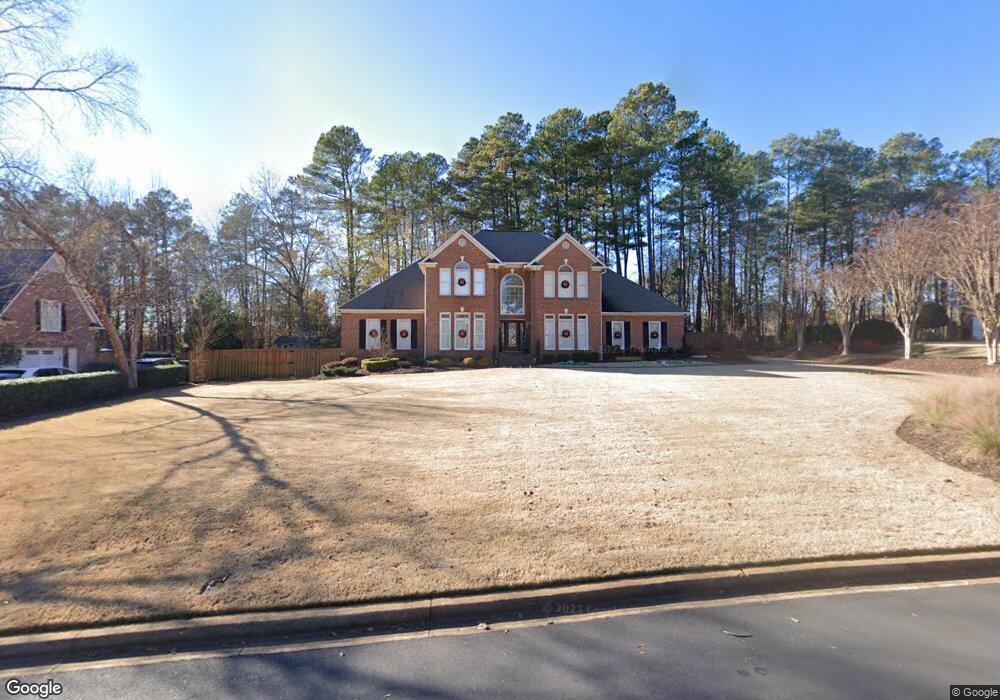
761 Glenridge Rd Spartanburg, SC 29301
Estimated Value: $608,816 - $707,000
4
Beds
4
Baths
3,484
Sq Ft
$189/Sq Ft
Est. Value
About This Home
This home is located at 761 Glenridge Rd, Spartanburg, SC 29301 and is currently estimated at $657,954, approximately $188 per square foot. 761 Glenridge Rd is a home located in Spartanburg County with nearby schools including Dorman High School Freshman Campus, Dorman High School, and Fine Arts Preparatory School.
Ownership History
Date
Name
Owned For
Owner Type
Purchase Details
Closed on
May 19, 2014
Sold by
Ezell Christie C
Bought by
Barber Stephen F
Current Estimated Value
Home Financials for this Owner
Home Financials are based on the most recent Mortgage that was taken out on this home.
Original Mortgage
$329,400
Outstanding Balance
$252,070
Interest Rate
4.44%
Mortgage Type
New Conventional
Estimated Equity
$405,884
Purchase Details
Closed on
Nov 11, 2011
Sold by
Ezell Roger D
Bought by
Ezell Christie C
Purchase Details
Closed on
Oct 5, 2009
Sold by
Ezell Roger
Bought by
Ezell Roger and Ezell Properties
Purchase Details
Closed on
Feb 8, 2008
Sold by
Ezell Roger
Bought by
Wynn Lawrence Bradley
Purchase Details
Closed on
Aug 30, 2007
Sold by
Nieman Michael J and Nieman Brenda L
Bought by
Ezell Roger D
Purchase Details
Closed on
Sep 27, 2000
Sold by
Mayhew Kenneth L and Mayhew Ruth G
Bought by
Nieman Michael J and Nieman Brenda L
Create a Home Valuation Report for This Property
The Home Valuation Report is an in-depth analysis detailing your home's value as well as a comparison with similar homes in the area
Home Values in the Area
Average Home Value in this Area
Purchase History
| Date | Buyer | Sale Price | Title Company |
|---|---|---|---|
| Barber Stephen F | $366,000 | -- | |
| Ezell Christie C | $320,000 | -- | |
| Ezell Roger | -- | -- | |
| Wynn Lawrence Bradley | $368,156 | None Available | |
| Ezell Roger D | $374,900 | None Available | |
| Nieman Michael J | $323,000 | -- |
Source: Public Records
Mortgage History
| Date | Status | Borrower | Loan Amount |
|---|---|---|---|
| Open | Barber Stephen F | $329,400 |
Source: Public Records
Tax History Compared to Growth
Tax History
| Year | Tax Paid | Tax Assessment Tax Assessment Total Assessment is a certain percentage of the fair market value that is determined by local assessors to be the total taxable value of land and additions on the property. | Land | Improvement |
|---|---|---|---|---|
| 2025 | $2,892 | $17,582 | $2,093 | $15,489 |
| 2024 | $2,892 | $17,582 | $2,093 | $15,489 |
| 2023 | $2,892 | $17,582 | $2,093 | $15,489 |
| 2022 | $2,682 | $15,288 | $2,000 | $13,288 |
| 2021 | $2,682 | $15,288 | $2,000 | $13,288 |
| 2020 | $2,621 | $15,288 | $2,000 | $13,288 |
| 2019 | $2,598 | $15,288 | $2,000 | $13,288 |
| 2018 | $2,575 | $15,288 | $2,000 | $13,288 |
| 2017 | $2,420 | $14,640 | $1,800 | $12,840 |
| 2016 | $2,369 | $14,640 | $1,800 | $12,840 |
| 2015 | $2,394 | $19,212 | $2,700 | $16,512 |
| 2014 | $2,038 | $12,808 | $1,800 | $11,008 |
Source: Public Records
Map
Nearby Homes
- 310 Slopingwood Ln
- 138 W Forest Dr
- 890 Acorn Ridge Place
- 381 Carleton Cir
- 405 Shafer Ct
- 853 Oakcrest Rd
- 316 Bohler Ln
- Magnolia Plan at Hadden Heights
- Chestnut Plan at Hadden Heights
- 412 Harrison Ln
- 161 Ravines Ln
- 114 Saluda St
- 710 Peyden Ln
- 720 Peyden Ln
- 710 Peyden Ln Unit HH 26 Magnolia A
- 714 Peyden Ln
- 720 Peyden Ln Unit HH 21 Chestnut B
- 714 Peyden Ln Unit HH 24 Magnolia A
- 307 Crandall Way
- 318 Ashwick Ct
- 749 Glenridge Rd
- 765 Glenridge Rd
- 119 W Woodglen Rd
- 123 W Woodglen Rd
- 745 Glenridge Rd
- 760 Glenridge Rd
- 769 Glenridge Rd
- 115 W Woodglen Rd
- 764 Glenridge Rd
- 127 W Woodglen Rd
- 750 Glenridge Rd
- 743 Glenridge Rd
- 111 W Woodglen Rd
- 770 Glenridge Rd
- 131 W Woodglen Rd
- 773 Glenridge Rd
- 737 Glenridge Rd
- 746 Glenridge Rd
- 774 Glenridge Rd
- 613 Oakhollow Ct