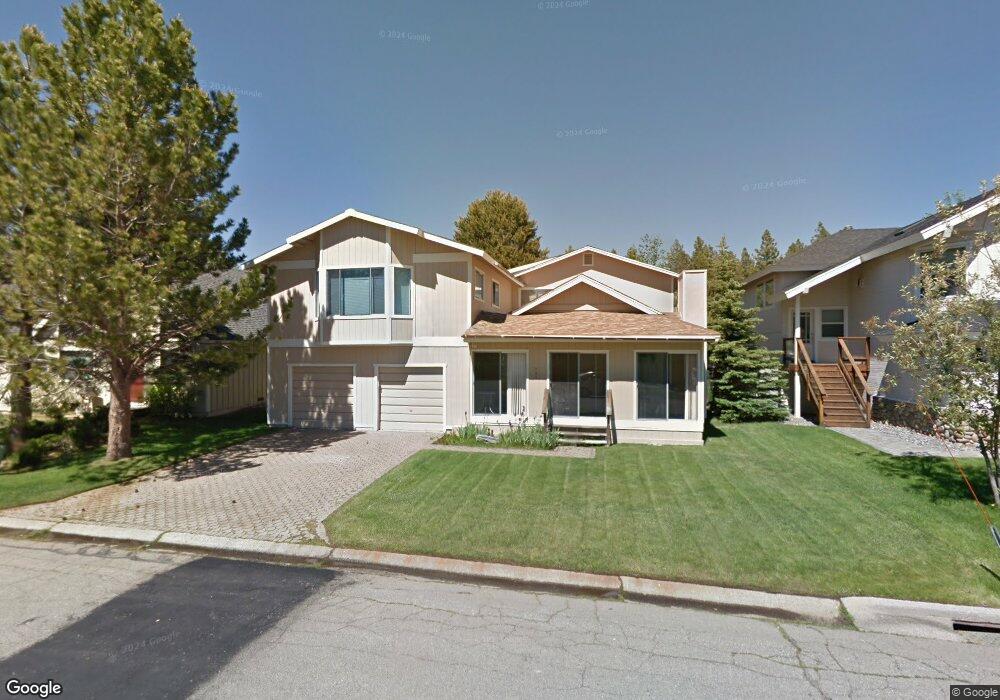
761 Lassen Dr Unit 1 South Lake Tahoe, CA 96150
Estimated Value: $766,000 - $1,112,000
4
Beds
3
Baths
2,013
Sq Ft
$433/Sq Ft
Est. Value
About This Home
This home is located at 761 Lassen Dr Unit 1, South Lake Tahoe, CA 96150 and is currently estimated at $872,411, approximately $433 per square foot. 761 Lassen Dr Unit 1 is a home located in El Dorado County with nearby schools including Tahoe Valley Elementary School, South Tahoe Middle School, and South Tahoe High School.
Ownership History
Date
Name
Owned For
Owner Type
Purchase Details
Closed on
Dec 13, 2016
Sold by
Woodward Marion A and Woodward Patricia R
Bought by
Woodward Marion A and Woodward Patricia R
Current Estimated Value
Purchase Details
Closed on
Dec 8, 2003
Sold by
Bott Geoffrey and Bott Maya
Bought by
Woodward Marion A and Woodward Patricia R
Home Financials for this Owner
Home Financials are based on the most recent Mortgage that was taken out on this home.
Original Mortgage
$322,700
Interest Rate
5.92%
Mortgage Type
Purchase Money Mortgage
Purchase Details
Closed on
Apr 30, 2001
Sold by
Bott Geoffrey and Bott Maya
Bought by
Bott Geoffrey and Bott Maya
Purchase Details
Closed on
Feb 23, 1999
Sold by
Patterson Rex A and Patterson Patricia J
Bought by
Bott Geoffrey and Bott Maya
Home Financials for this Owner
Home Financials are based on the most recent Mortgage that was taken out on this home.
Original Mortgage
$160,000
Interest Rate
6.78%
Create a Home Valuation Report for This Property
The Home Valuation Report is an in-depth analysis detailing your home's value as well as a comparison with similar homes in the area
Home Values in the Area
Average Home Value in this Area
Purchase History
| Date | Buyer | Sale Price | Title Company |
|---|---|---|---|
| Woodward Marion A | -- | None Available | |
| Woodward Marion A | $425,500 | Placer Title Co | |
| Bott Geoffrey | -- | -- | |
| Bott Geoffrey | -- | -- | |
| Bott Geoffrey | $200,000 | Fidelity National Title Co |
Source: Public Records
Mortgage History
| Date | Status | Borrower | Loan Amount |
|---|---|---|---|
| Previous Owner | Woodward Marion A | $322,700 | |
| Previous Owner | Bott Geoffrey | $160,000 |
Source: Public Records
Tax History Compared to Growth
Tax History
| Year | Tax Paid | Tax Assessment Tax Assessment Total Assessment is a certain percentage of the fair market value that is determined by local assessors to be the total taxable value of land and additions on the property. | Land | Improvement |
|---|---|---|---|---|
| 2025 | $6,375 | $604,949 | $156,385 | $448,564 |
| 2024 | $6,375 | $593,088 | $153,319 | $439,769 |
| 2023 | $6,264 | $581,460 | $150,313 | $431,147 |
| 2022 | $6,202 | $570,060 | $147,366 | $422,694 |
| 2021 | $6,106 | $558,883 | $144,477 | $414,406 |
| 2020 | $6,017 | $553,153 | $142,996 | $410,157 |
| 2019 | $5,988 | $542,308 | $140,193 | $402,115 |
| 2018 | $5,855 | $531,676 | $137,445 | $394,231 |
| 2017 | $5,762 | $521,251 | $134,750 | $386,501 |
| 2016 | $5,645 | $511,031 | $132,108 | $378,923 |
| 2015 | $5,016 | $461,500 | $119,500 | $342,000 |
| 2014 | $5,016 | $461,500 | $119,500 | $342,000 |
Source: Public Records
Map
Nearby Homes
- 2244 Texas Ave
- 2191 Butler Ave
- 914 Tahoe Island Dr
- 783 Michael Ct Unit Share B
- 783 Michael Ct
- 803 Michael Dr
- 741 Tahoe Island Dr
- 2185 Morro Dr
- 724 Tahoe Island Dr
- 2081 Venice Dr Unit 285
- 2081 Venice Dr Unit 280
- 569 Lucerne Way
- 555 Tahoe Keys Blvd Unit 13
- 2071 Venice Dr Unit 294
- 776 Patricia Ln
- 552 Christie Dr Unit 307
- 552 Christie Dr Unit 303
- 497 Tahoe Keys Blvd Unit 20
- 2337 Sky Meadows Ct
- 2031 Venice Dr Unit 322