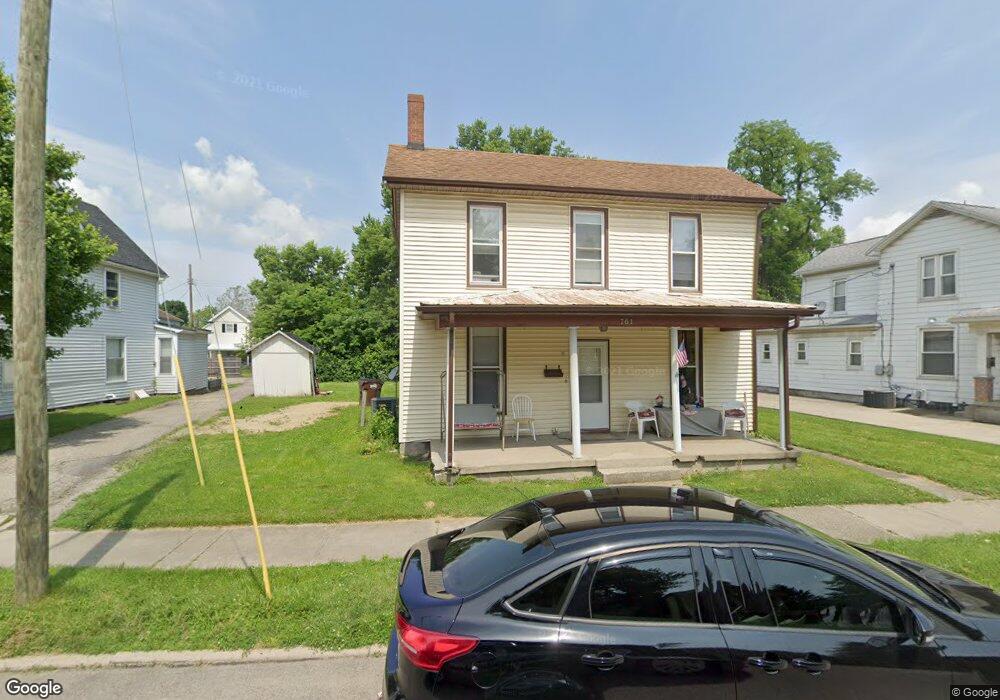
761 S Main St Franklin, OH 45005
Estimated Value: $195,000 - $205,000
3
Beds
2
Baths
1,747
Sq Ft
$115/Sq Ft
Est. Value
About This Home
This home is located at 761 S Main St, Franklin, OH 45005 and is currently estimated at $201,204, approximately $115 per square foot. 761 S Main St is a home located in Warren County with nearby schools including Franklin High School.
Ownership History
Date
Name
Owned For
Owner Type
Purchase Details
Closed on
Nov 5, 2024
Sold by
Dorsey Dyas Family Real Estate Holdings
Bought by
Engle Marveline
Current Estimated Value
Home Financials for this Owner
Home Financials are based on the most recent Mortgage that was taken out on this home.
Original Mortgage
$197,000
Outstanding Balance
$195,024
Interest Rate
6.08%
Mortgage Type
VA
Estimated Equity
$6,180
Purchase Details
Closed on
Dec 31, 2003
Sold by
Dyas Mark A and Dorsey William Roscoe
Bought by
Dorsey Dyas Family Real Estate Holdings
Purchase Details
Closed on
Aug 31, 1992
Sold by
Ralph Dorsey and Ralph Wm.
Bought by
Ralph Dorsey and Ralph Wm.
Purchase Details
Closed on
Apr 9, 1992
Sold by
Edwards Edwards and Edwards Louis Howard
Bought by
Edwards Edwards and Edwards Louis Howard
Purchase Details
Closed on
May 27, 1983
Sold by
Edwards Edwards and Edwards Frances Blythe
Bought by
Edwards Edwards and Edwards Louis Howard
Create a Home Valuation Report for This Property
The Home Valuation Report is an in-depth analysis detailing your home's value as well as a comparison with similar homes in the area
Home Values in the Area
Average Home Value in this Area
Purchase History
| Date | Buyer | Sale Price | Title Company |
|---|---|---|---|
| Engle Marveline | $197,000 | Chicago Title | |
| Dorsey Dyas Family Real Estate Holdings | -- | -- | |
| Ralph Dorsey | $4,900 | -- | |
| Edwards Edwards | -- | -- | |
| Edwards Edwards | -- | -- |
Source: Public Records
Mortgage History
| Date | Status | Borrower | Loan Amount |
|---|---|---|---|
| Open | Engle Marveline | $197,000 |
Source: Public Records
Tax History Compared to Growth
Tax History
| Year | Tax Paid | Tax Assessment Tax Assessment Total Assessment is a certain percentage of the fair market value that is determined by local assessors to be the total taxable value of land and additions on the property. | Land | Improvement |
|---|---|---|---|---|
| 2024 | $1,743 | $36,220 | $10,790 | $25,430 |
| 2023 | $1,445 | $26,939 | $6,121 | $20,818 |
| 2022 | $1,417 | $26,940 | $6,122 | $20,818 |
| 2021 | $1,342 | $26,940 | $6,122 | $20,818 |
| 2020 | $1,208 | $21,378 | $4,858 | $16,520 |
| 2019 | $1,101 | $21,378 | $4,858 | $16,520 |
| 2018 | $1,086 | $21,378 | $4,858 | $16,520 |
| 2017 | $1,140 | $20,223 | $4,666 | $15,558 |
| 2016 | $1,162 | $20,223 | $4,666 | $15,558 |
| 2015 | $1,162 | $20,223 | $4,666 | $15,558 |
| 2014 | $1,178 | $20,220 | $4,670 | $15,560 |
| 2013 | $1,016 | $23,400 | $5,400 | $18,000 |
Source: Public Records
Map
Nearby Homes
- 820 S River St
- 235 S Main St
- 233 S Main St
- 631 S River St
- 1200 Riley Blvd
- 521 S Main St
- 1007 S River St
- 519 Anderson St
- 1010 S Main St
- 0 E 4th St
- 121 E 5th St
- 441 Sunnybrook Dr
- 410 Park Ave
- 509 Forest Ave
- 511 Forest Ave
- 0 Kathy Ln Unit 1834240
- 0 Kathy Ln Unit 930066
- 50 N Main St
- 418 Home Ave
- 521 Spring Ave