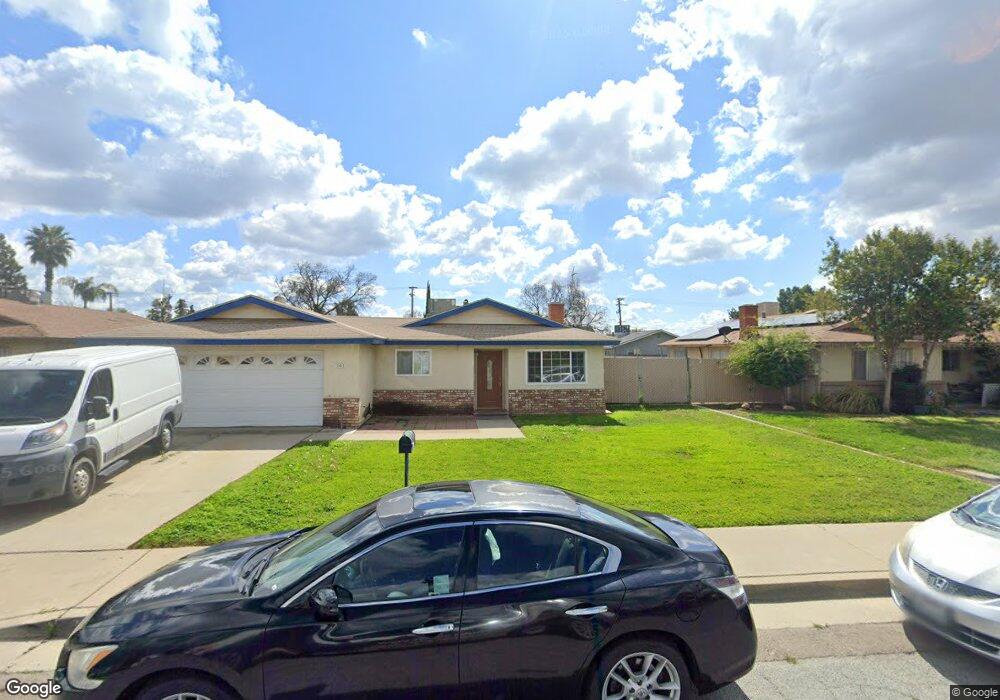
761 Sandra Ln Porterville, CA 93257
Porterville Northwest NeighborhoodEstimated Value: $275,705 - $310,000
3
Beds
2
Baths
1,250
Sq Ft
$232/Sq Ft
Est. Value
About This Home
This home is located at 761 Sandra Ln, Porterville, CA 93257 and is currently estimated at $290,426, approximately $232 per square foot. 761 Sandra Ln is a home located in Tulare County with nearby schools including Monte Vista Elementary School, Strathmore Elementary School, and Sequoia Middle School.
Ownership History
Date
Name
Owned For
Owner Type
Purchase Details
Closed on
May 18, 2011
Sold by
U S Bank National Association Nd
Bought by
Fowler Susan K
Current Estimated Value
Purchase Details
Closed on
Jan 24, 2011
Sold by
Black Billy J
Bought by
U S Bank National Association Nd
Purchase Details
Closed on
Jun 16, 2000
Sold by
Black Billy J
Bought by
Black Billy J and Black Susan R
Home Financials for this Owner
Home Financials are based on the most recent Mortgage that was taken out on this home.
Original Mortgage
$13,937
Interest Rate
8.67%
Mortgage Type
Stand Alone Second
Purchase Details
Closed on
Mar 31, 1997
Sold by
Parrott Mae Inez
Bought by
Black Billy J
Home Financials for this Owner
Home Financials are based on the most recent Mortgage that was taken out on this home.
Original Mortgage
$74,100
Interest Rate
7.86%
Mortgage Type
Purchase Money Mortgage
Create a Home Valuation Report for This Property
The Home Valuation Report is an in-depth analysis detailing your home's value as well as a comparison with similar homes in the area
Home Values in the Area
Average Home Value in this Area
Purchase History
| Date | Buyer | Sale Price | Title Company |
|---|---|---|---|
| Fowler Susan K | $67,500 | Orange Coast Title Company | |
| U S Bank National Association Nd | $92,000 | None Available | |
| Black Billy J | -- | Cuesta Title Company | |
| Black Billy J | $78,000 | Chicago Title Co |
Source: Public Records
Mortgage History
| Date | Status | Borrower | Loan Amount |
|---|---|---|---|
| Previous Owner | Black Billy J | $13,937 | |
| Previous Owner | Black Billy J | $74,100 | |
| Closed | Black Billy J | $7,763 |
Source: Public Records
Tax History
| Year | Tax Paid | Tax Assessment Tax Assessment Total Assessment is a certain percentage of the fair market value that is determined by local assessors to be the total taxable value of land and additions on the property. | Land | Improvement |
|---|---|---|---|---|
| 2025 | $918 | $86,474 | $32,026 | $54,448 |
| 2024 | $918 | $84,780 | $31,399 | $53,381 |
| 2023 | $918 | $83,119 | $30,784 | $52,335 |
| 2022 | $889 | $81,490 | $30,181 | $51,309 |
| 2021 | $879 | $79,892 | $29,589 | $50,303 |
| 2020 | $869 | $79,073 | $29,286 | $49,787 |
| 2019 | $854 | $77,523 | $28,712 | $48,811 |
| 2018 | $839 | $76,003 | $28,149 | $47,854 |
| 2017 | $818 | $74,513 | $27,597 | $46,916 |
| 2016 | $785 | $73,052 | $27,056 | $45,996 |
| 2015 | $755 | $71,955 | $26,650 | $45,305 |
| 2014 | $755 | $70,546 | $26,128 | $44,418 |
Source: Public Records
Map
Nearby Homes
- 840 Sandra Ln
- 861 W Mulberry Ave
- 751 W Westfield Ave
- 643 W Bel Aire Ln
- 1081 Stonegate Cove Dr
- 506 W Westfield Ave
- 809 Pioneer Ave
- 1120 W Mulberry Ave
- 1112 Bel Aire Cir
- 637 Village Green St
- 816 W Grand Ave
- 818 W Grand Ave
- 1253 W Jean Ave
- 1021 W Grand Ave
- 0 N Marshall St
- 1495 N Highland Dr
- 479 W Grand Ave
- 1465 N Highland Dr
- 700 N Prospect St
- 1380 N Highland Dr
- 751 Sandra Ln
- 771 Sandra Ln
- 771 Sandra Ln
- 760 W Mulberry Ave
- 750 W Mulberry Ave
- 770 W Mulberry Ave
- 741 Sandra Ln
- 781 Sandra Ln
- 760 Sandra Ln
- 740 W Mulberry Ave
- 750 Sandra Ln
- 780 W Mulberry Ave
- 770 Sandra Ln
- 740 Sandra Ln
- 731 Sandra Ln
- 780 Sandra Ln
- 730 W Mulberry Ave
- 983 Ohio St
- 730 Sandra Ln
- 761 Gerry Ln
Your Personal Tour Guide
Ask me questions while you tour the home.