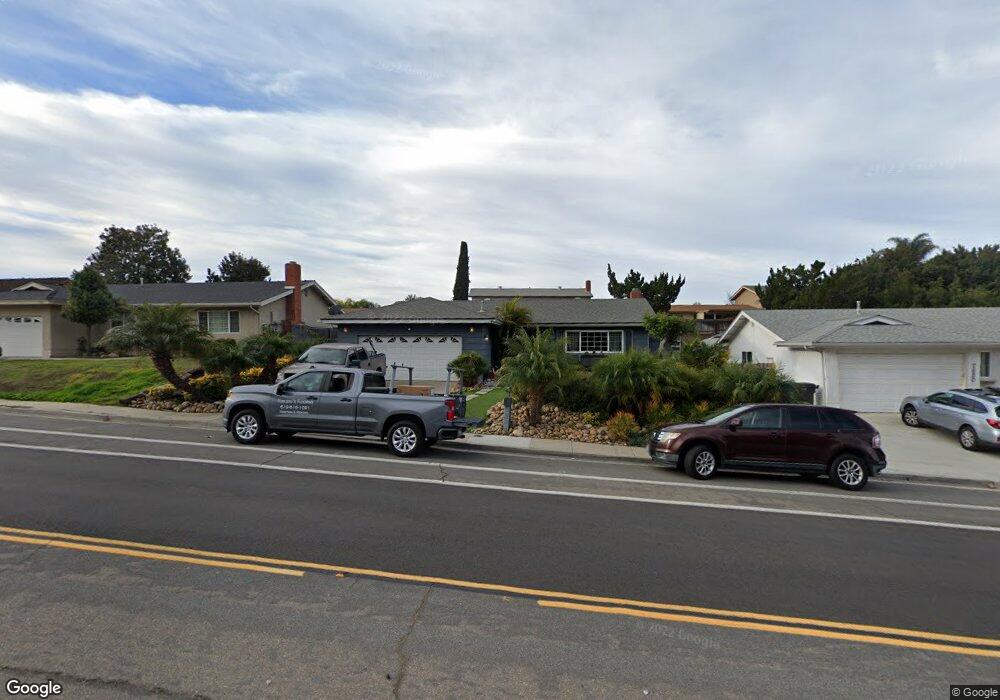
7610 Golfcrest Dr San Diego, CA 92119
San Carlos NeighborhoodEstimated Value: $1,038,094 - $1,151,000
3
Beds
2
Baths
1,656
Sq Ft
$666/Sq Ft
Est. Value
About This Home
This home is located at 7610 Golfcrest Dr, San Diego, CA 92119 and is currently estimated at $1,102,774, approximately $665 per square foot. 7610 Golfcrest Dr is a home located in San Diego County with nearby schools including Ralph Dailard Elementary School, Pershing Middle School, and Patrick Henry High School.
Ownership History
Date
Name
Owned For
Owner Type
Purchase Details
Closed on
Jul 23, 2018
Sold by
Denham Dennis L and Denham Kathryn A
Bought by
Denham Dennis L and Denham Kathryn A
Current Estimated Value
Home Financials for this Owner
Home Financials are based on the most recent Mortgage that was taken out on this home.
Original Mortgage
$254,000
Interest Rate
4.5%
Mortgage Type
New Conventional
Purchase Details
Closed on
Jun 15, 1993
Sold by
Lewis William A and Lewis Carol
Bought by
Denham Dennis L and Denham Kathryn A
Home Financials for this Owner
Home Financials are based on the most recent Mortgage that was taken out on this home.
Original Mortgage
$152,000
Interest Rate
7.25%
Purchase Details
Closed on
May 2, 1988
Create a Home Valuation Report for This Property
The Home Valuation Report is an in-depth analysis detailing your home's value as well as a comparison with similar homes in the area
Home Values in the Area
Average Home Value in this Area
Purchase History
| Date | Buyer | Sale Price | Title Company |
|---|---|---|---|
| Denham Dennis L | -- | Ticor Title San Diego Branch | |
| Denham Dennis L | $195,000 | Guardian Title Company | |
| -- | $160,000 | -- |
Source: Public Records
Mortgage History
| Date | Status | Borrower | Loan Amount |
|---|---|---|---|
| Previous Owner | Denham Dennis L | $254,000 | |
| Previous Owner | Denham Dennis L | $152,000 |
Source: Public Records
Tax History Compared to Growth
Tax History
| Year | Tax Paid | Tax Assessment Tax Assessment Total Assessment is a certain percentage of the fair market value that is determined by local assessors to be the total taxable value of land and additions on the property. | Land | Improvement |
|---|---|---|---|---|
| 2025 | $3,900 | $322,903 | $120,081 | $202,822 |
| 2024 | $3,900 | $316,573 | $117,727 | $198,846 |
| 2023 | $3,825 | $310,367 | $115,419 | $194,948 |
| 2022 | $3,722 | $304,282 | $113,156 | $191,126 |
| 2021 | $3,694 | $298,317 | $110,938 | $187,379 |
| 2020 | $3,650 | $295,259 | $109,801 | $185,458 |
| 2019 | $3,583 | $289,471 | $107,649 | $181,822 |
| 2018 | $3,349 | $283,796 | $105,539 | $178,257 |
| 2017 | $3,268 | $278,232 | $103,470 | $174,762 |
| 2016 | $3,213 | $272,778 | $101,442 | $171,336 |
| 2015 | $3,165 | $268,682 | $99,919 | $168,763 |
| 2014 | $3,105 | $263,420 | $97,962 | $165,458 |
Source: Public Records
Map
Nearby Homes
- 7811 Golfcrest Dr
- 8076 El Extenso Ct
- 7329 Melotte St
- 6626 Tuxedo Rd
- 7270 Rondel Ct
- 6670 Bell Bluff Ave
- 7224 Melotte St
- 6592 Bell Bluff Ave
- 7363 Birchcreek Rd
- 6647 Bell Bluff Ave
- 8041 Laurelridge Rd
- 6548 Bell Bluff Ave Unit 33C
- 6878 Navajo Rd Unit 70
- 7426 Caminito Carlotta
- 7328 Caminito Carlotta
- 8293 Echo Dell Rd
- 6877 Caminito Mundo Unit 25
- 7360 Park Ridge Blvd Unit 119
- 6755 Caminito Del Greco
- 6960 Hyde Park Dr Unit 8
- 7620 Golfcrest Dr
- 7592 Golfcrest Dr
- 7588 Golfcrest Dr
- 7611 Melotte St
- 7605 Melotte St
- 7619 Melotte St
- 7582 Golfcrest Dr
- 7630 Golfcrest Dr
- 7597 Melotte St
- 7625 Melotte St
- 7572 Golfcrest Dr
- 7621 Golfcrest Dr
- 7611 Golfcrest Dr
- 7587 Melotte St
- 7631 Melotte St
- 7631 Golfcrest Dr
- 7595 Golfcrest Dr
- 7612 Melotte St
- 7606 Melotte St
- 7641 Golfcrest Dr