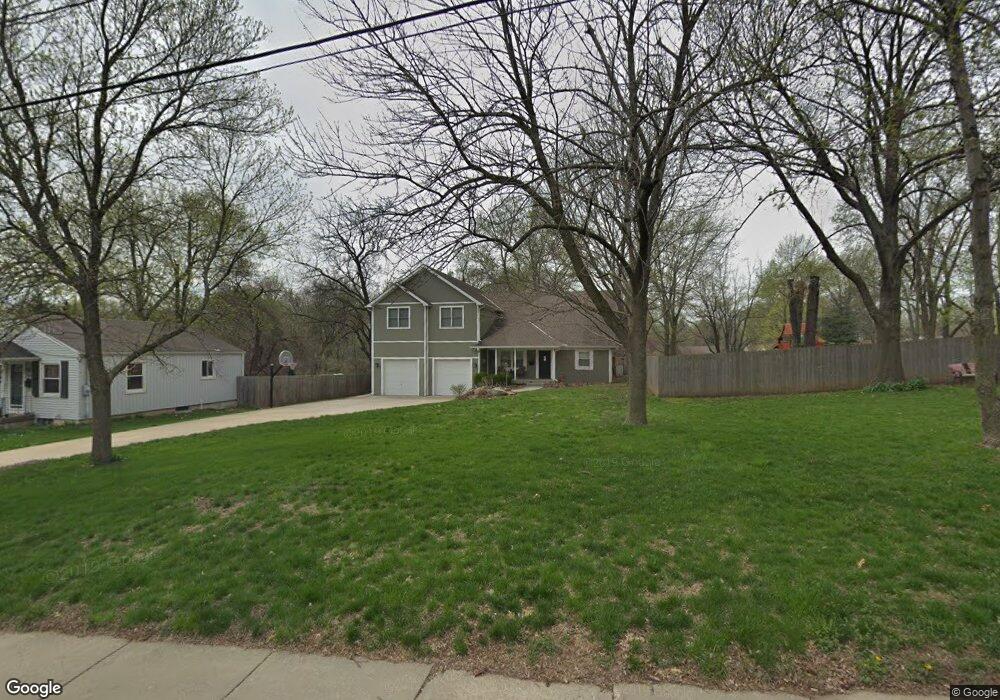
7612 Eby Ln Overland Park, KS 66204
Estimated Value: $474,129 - $496,000
5
Beds
4
Baths
2,768
Sq Ft
$176/Sq Ft
Est. Value
About This Home
This home is located at 7612 Eby Ln, Overland Park, KS 66204 and is currently estimated at $487,282, approximately $176 per square foot. 7612 Eby Ln is a home located in Johnson County with nearby schools including Comanche Elementary School, Westridge Middle School, and Shawnee Mission West High School.
Ownership History
Date
Name
Owned For
Owner Type
Purchase Details
Closed on
Jun 13, 2023
Sold by
Figueroa Paige Christian
Bought by
Figeroa Paige Christian
Current Estimated Value
Purchase Details
Closed on
Sep 4, 2019
Sold by
Blumentritt John and Tayntor Laurie
Bought by
Adams Paige Christian
Home Financials for this Owner
Home Financials are based on the most recent Mortgage that was taken out on this home.
Original Mortgage
$225,000
Interest Rate
3.7%
Mortgage Type
New Conventional
Purchase Details
Closed on
Jan 7, 2016
Sold by
Flynn Brandon K and Flynn Regina M
Bought by
Blumentritt Joh and Tayntor Laurie
Purchase Details
Closed on
Oct 26, 2005
Sold by
Flynn Brandon K and Flynn Regina M
Bought by
Flynn Brandon K and Flynn Regina M
Home Financials for this Owner
Home Financials are based on the most recent Mortgage that was taken out on this home.
Original Mortgage
$180,000
Interest Rate
5.73%
Mortgage Type
New Conventional
Create a Home Valuation Report for This Property
The Home Valuation Report is an in-depth analysis detailing your home's value as well as a comparison with similar homes in the area
Home Values in the Area
Average Home Value in this Area
Purchase History
| Date | Buyer | Sale Price | Title Company |
|---|---|---|---|
| Figeroa Paige Christian | -- | None Listed On Document | |
| Adams Paige Christian | -- | None Available | |
| Blumentritt Joh | -- | None Available | |
| Flynn Brandon K | -- | National Title Agency7 |
Source: Public Records
Mortgage History
| Date | Status | Borrower | Loan Amount |
|---|---|---|---|
| Previous Owner | Adams Paige Christian | $225,000 | |
| Previous Owner | Flynn Brandon K | $180,000 |
Source: Public Records
Tax History Compared to Growth
Tax History
| Year | Tax Paid | Tax Assessment Tax Assessment Total Assessment is a certain percentage of the fair market value that is determined by local assessors to be the total taxable value of land and additions on the property. | Land | Improvement |
|---|---|---|---|---|
| 2024 | $4,542 | $46,909 | $4,429 | $42,480 |
| 2023 | $4,371 | $44,586 | $4,429 | $40,157 |
| 2022 | $4,114 | $42,251 | $4,027 | $38,224 |
| 2021 | $4,114 | $39,307 | $4,027 | $35,280 |
| 2020 | $3,521 | $34,500 | $3,227 | $31,273 |
| 2019 | $3,659 | $35,880 | $3,227 | $32,653 |
| 2018 | $3,844 | $37,525 | $3,227 | $34,298 |
| 2017 | $3,313 | $31,832 | $3,227 | $28,605 |
| 2016 | $3,322 | $31,395 | $3,227 | $28,168 |
| 2015 | $3,087 | $29,762 | $3,227 | $26,535 |
| 2013 | -- | $22,805 | $3,227 | $19,578 |
Source: Public Records
Map
Nearby Homes
- 8708 W 76th Terrace
- 7522 Mackey St
- 7859 Kessler Ln
- 7649 Mackey St
- 7909 Grandview St
- 8401 W 77th St
- 7301 Antioch Rd
- 8713 W 72nd St
- 7923 Hadley St
- 8037 Grandview Ln
- 8808 W 81st Terrace
- 7205 Woodward St
- 9312 W 81st Terrace
- 7240 Mastin St
- 9317 W 82nd St
- 8113 Hadley St
- 8201 Antioch Rd
- 7808 W 74th St
- 8101 Goodman St
- 7139 Hardy St