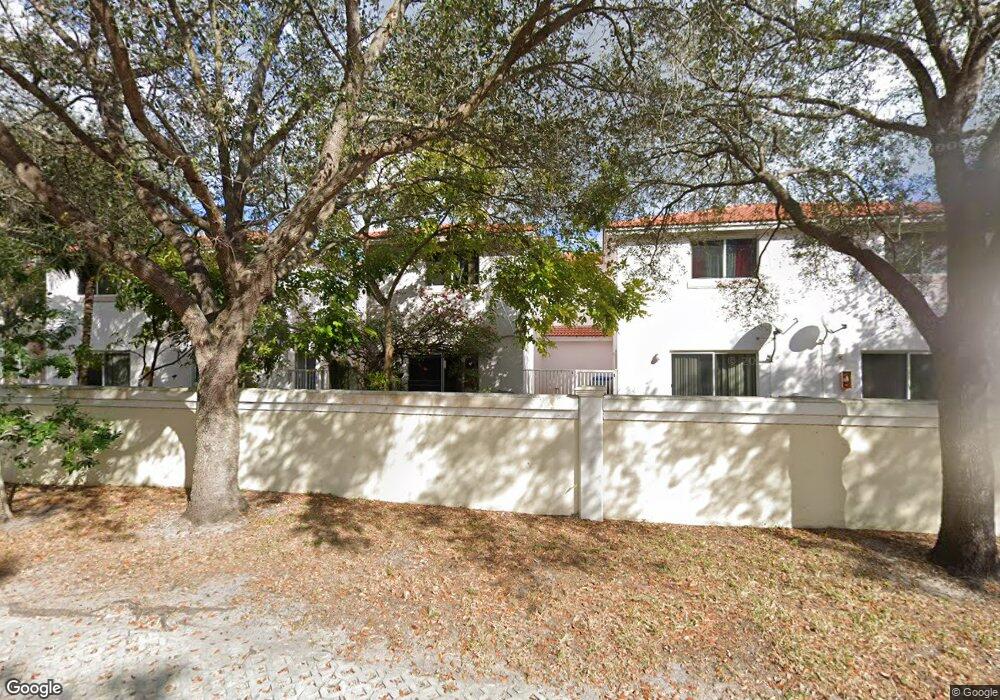
7613 Tamarac Island Cir Unit B7613 Tamarac, FL 33321
Estimated Value: $321,000 - $343,000
4
Beds
3
Baths
1,450
Sq Ft
$227/Sq Ft
Est. Value
About This Home
This home is located at 7613 Tamarac Island Cir Unit B7613, Tamarac, FL 33321 and is currently estimated at $329,655, approximately $227 per square foot. 7613 Tamarac Island Cir Unit B7613 is a home located in Broward County with nearby schools including Tamarac Elementary School, Millennium 6-12 Collegiate Academy, and J. P. Taravella High School.
Ownership History
Date
Name
Owned For
Owner Type
Purchase Details
Closed on
Sep 25, 2015
Sold by
Pine Leslie T and Delgado Jaime A
Bought by
Invextep Llc
Current Estimated Value
Purchase Details
Closed on
Jan 7, 2005
Sold by
Marks Amber and Marks Karl
Bought by
Pine Leslie T
Home Financials for this Owner
Home Financials are based on the most recent Mortgage that was taken out on this home.
Original Mortgage
$190,000
Interest Rate
5.71%
Mortgage Type
Purchase Money Mortgage
Purchase Details
Closed on
Nov 28, 2003
Sold by
Marks Amber A and Weiss Amber Anne
Bought by
Marks Karl W and Marks Amber A
Purchase Details
Closed on
Sep 26, 2001
Sold by
Oceanic Rose Developer Inc
Bought by
Weiss Amber Anne
Home Financials for this Owner
Home Financials are based on the most recent Mortgage that was taken out on this home.
Original Mortgage
$110,320
Interest Rate
6.89%
Create a Home Valuation Report for This Property
The Home Valuation Report is an in-depth analysis detailing your home's value as well as a comparison with similar homes in the area
Home Values in the Area
Average Home Value in this Area
Purchase History
| Date | Buyer | Sale Price | Title Company |
|---|---|---|---|
| Invextep Llc | $205,000 | Attorney | |
| Pine Leslie T | $200,000 | Supreme Title | |
| Marks Karl W | -- | Town & Country Title Guarant | |
| Weiss Amber Anne | $137,900 | -- |
Source: Public Records
Mortgage History
| Date | Status | Borrower | Loan Amount |
|---|---|---|---|
| Previous Owner | Pine Leslie T | $190,000 | |
| Previous Owner | Weiss Amber Anne | $110,320 |
Source: Public Records
Tax History Compared to Growth
Tax History
| Year | Tax Paid | Tax Assessment Tax Assessment Total Assessment is a certain percentage of the fair market value that is determined by local assessors to be the total taxable value of land and additions on the property. | Land | Improvement |
|---|---|---|---|---|
| 2025 | $7,217 | $301,070 | $30,110 | $270,960 |
| 2024 | $6,788 | $301,070 | $30,110 | $270,960 |
| 2023 | $6,788 | $272,390 | $0 | $0 |
| 2022 | $6,036 | $247,630 | $0 | $0 |
| 2021 | $5,584 | $225,120 | $0 | $0 |
| 2020 | $5,157 | $206,630 | $20,660 | $185,970 |
| 2019 | $4,766 | $186,060 | $18,610 | $167,450 |
| 2018 | $4,903 | $195,040 | $19,500 | $175,540 |
| 2017 | $4,734 | $184,760 | $0 | $0 |
| 2016 | $4,740 | $180,520 | $0 | $0 |
| 2015 | $1,933 | $98,240 | $0 | $0 |
| 2014 | $1,933 | $97,470 | $0 | $0 |
| 2013 | -- | $96,030 | $9,600 | $86,430 |
Source: Public Records
Map
Nearby Homes
- 7659 NW 74th Ave
- 7391 NW 76th St
- 7500 NW 75th St
- 7611 NW 72nd Way
- 7830 N University Dr
- 7222 Primrose Ln
- 7906 NW 75th Ave
- 7421 NW 72nd Ave
- 7609 NW 70th Ave
- 7001 NW 76th Ct
- 7680 NW 79th Ave Unit P1
- 7105 NW 73rd Ave
- 8009 NW 71st Ct
- 7780 NW 79th Ave Unit F6
- 7610 NW 79th Ave Unit I5
- 7720 NW 79th Ave Unit B2
- 7720 NW 79th Ave Unit B6
- 7750 NW 79th Ave Unit H4
- 7750 NW 79th Ave Unit H5
- 7670 NW 79th Ave Unit O5
- 7663 Tamarac Island Cir Unit 7663
- 7609 Tamarac Island Cir Unit 7609
- 7613 Tamarac Island Cir Unit 7613
- 7609 Tamarac Island Cir Unit 7609
- 7615 Tamarac Island Cir Unit 7615
- 7669 Tamarac Island Cir Unit 7669
- 7679 Tamarac Island Cir
- 7649 Tamarac Island Cir Unit 7649
- 7653 Tamarac Island Cir
- 7643 Tamarac Island Cir Unit 7643
- 7663 Tamarac Island Cir Unit 7663
- 7629 Tamarac Island Cir Unit 7629
- 7651 Tamarac Island Cir Unit 7651
- 7689 Tamarac Island Cir Unit 7689
- 7659 Tamarac Island Cir
- 7623 Tamarac Island Cir Unit 7623
- 7617 Tamarac Island Cir Unit 7617
- 7611 Tamarac Island Cir Unit 7611